The Superconducting Transition Temperatures of C-S-H Based on Inter-Sublattice S–H4-Tetrahedron Electronic Interactions, D. R. Harshman and A. T. Fiory [arXiv_v1]
Significant characteristics of the superconducting transitions reported for carbonaceous sulfur hydride [Snider et al., Nature 585, 373 (2020)] are the exceptionally abrupt onset temperatures and their marked increase toward room temperature at high pressure. Theoretical and experimental studies addressing the superconducting composition and structure have thus far returned mixed results. One possibility, consistent with the experimentally suggested stoichiometry of CSHx, is the theoretically-discovered compressed I43m CSH7 structure [Sun et al., Phys. Rev. B 101, 174102 (2020)], which comprises a sublattice similar to Im3m H3S with CH4 intercalates. Positing an electronic genesis of the superconductivity, a model is presented in analogy with earlier work on superconductivity in Im3m H3S, in which pairing is induced via purely electronic Coulomb interactions across the mean distance ζ between the S and H4 tetrahedra enclosing C. Theoretical superconducting transition temperatures for I43m CSH7 are derived as TC0 = (2/3)1/2σ1/2β/aζ, where β = 1247.4 Å2K is a universal constant, σ is the participating charge fraction, and a is the lattice parameter. Analysis suggests persistent bulk superconductivity with a pressure-dependent σ, increasing from σ = 3.5, determined previously for Im3m H3S, to σ = 7.5 at high pressure owing to additionally participating C-H bond electrons. With a and ζ determined by theoretical structure, TC0 = 283.6 ± 3.5 K is predicted at 267 ± 10 GPa, in excellent agreement (within uncertainty) with the corresponding experimental TC = 287.7 ± 1.2 K. Pressure-induced variations in σ combined with experimental uncertainties in pressure yield overall average (TC − TC0) = (−0.8 ± 3.5).
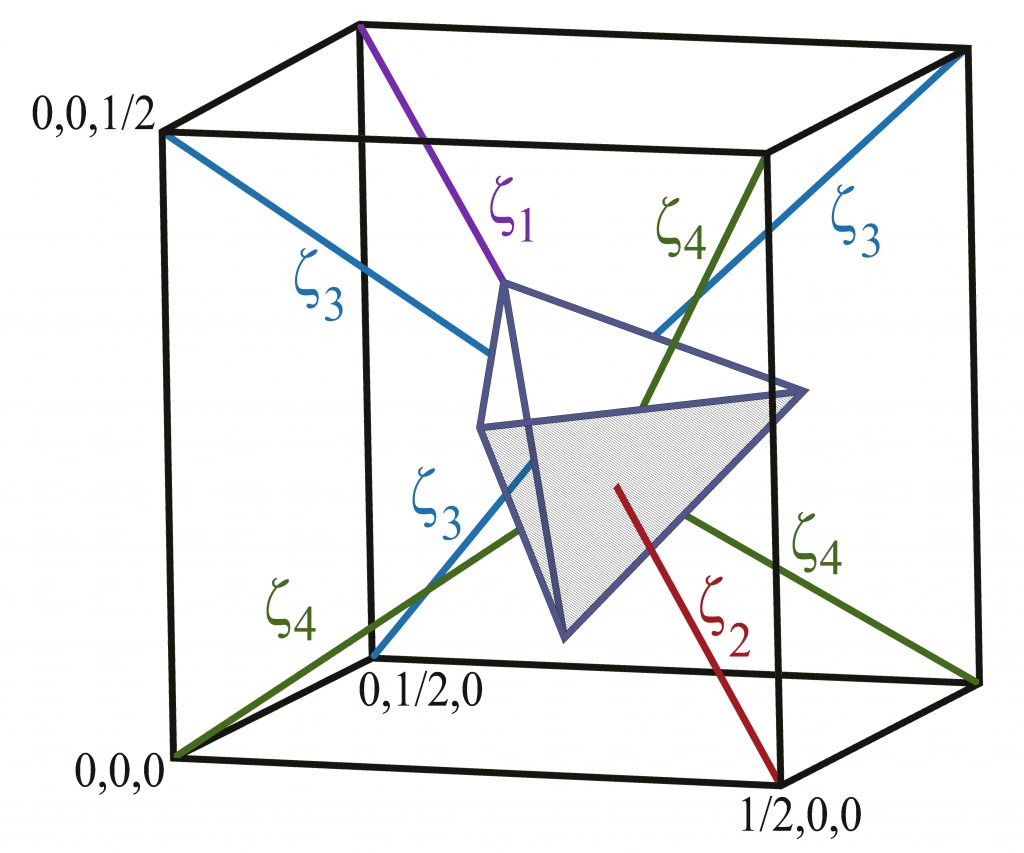
Figure 1. Schematic structure of 43m CSH7, indicating the four distances ζ1, ζ2, ζ3, and ζ4 for calculating the average ζ, the H4-tetrahedron, and coordinates of S ions located at cube corners.
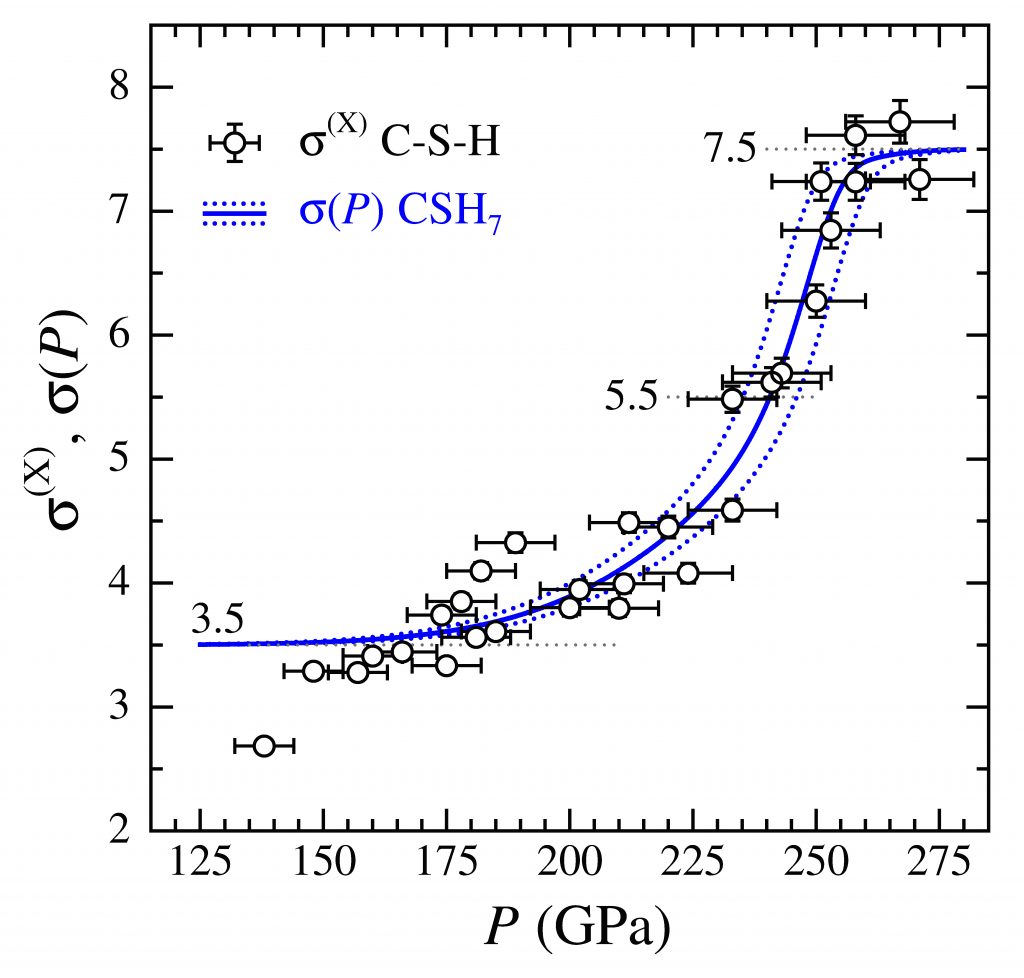
Figure 2. The extracted σ(X) data (open circles) as defined in Eq. (3) in the paper, plotted as a function of pressure P. The solid blue curve is a fit of the function σ(P) from Eq. (5) in the paper to the data. The dotted curves represent the calculated uncertainty. The dashed horizontal lines at 3.5, 5.5, and 7.5 correspond to charge fractions for H3S (7/2), H3S + H4 (11/2), and H3S + CH4 (15/2), respectively.
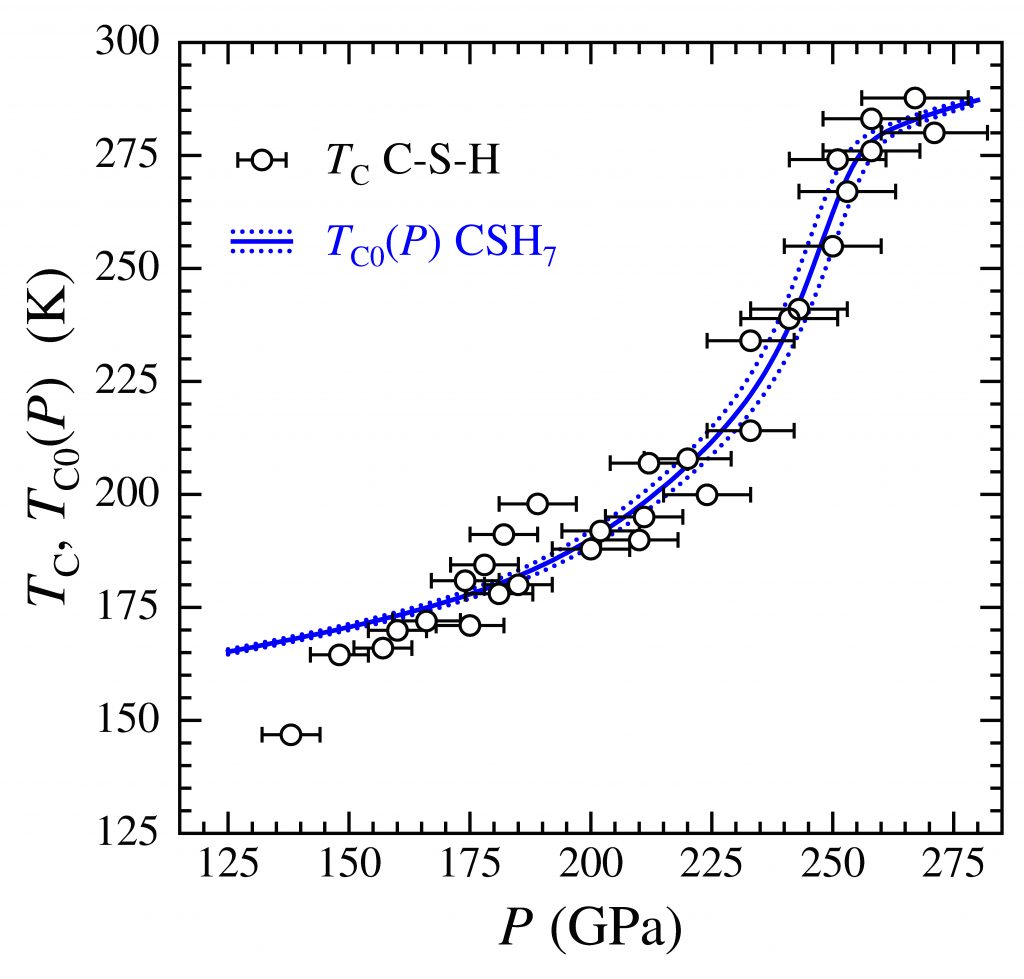
Figure 3. Measured transition temperature TC vs. pressure P after Ref. 1 in the paper (open circles). The solid blue curve is TC0(P) from Eq. (6) in the paper to the data. The dotted blue curves represent the calculated uncertainty.
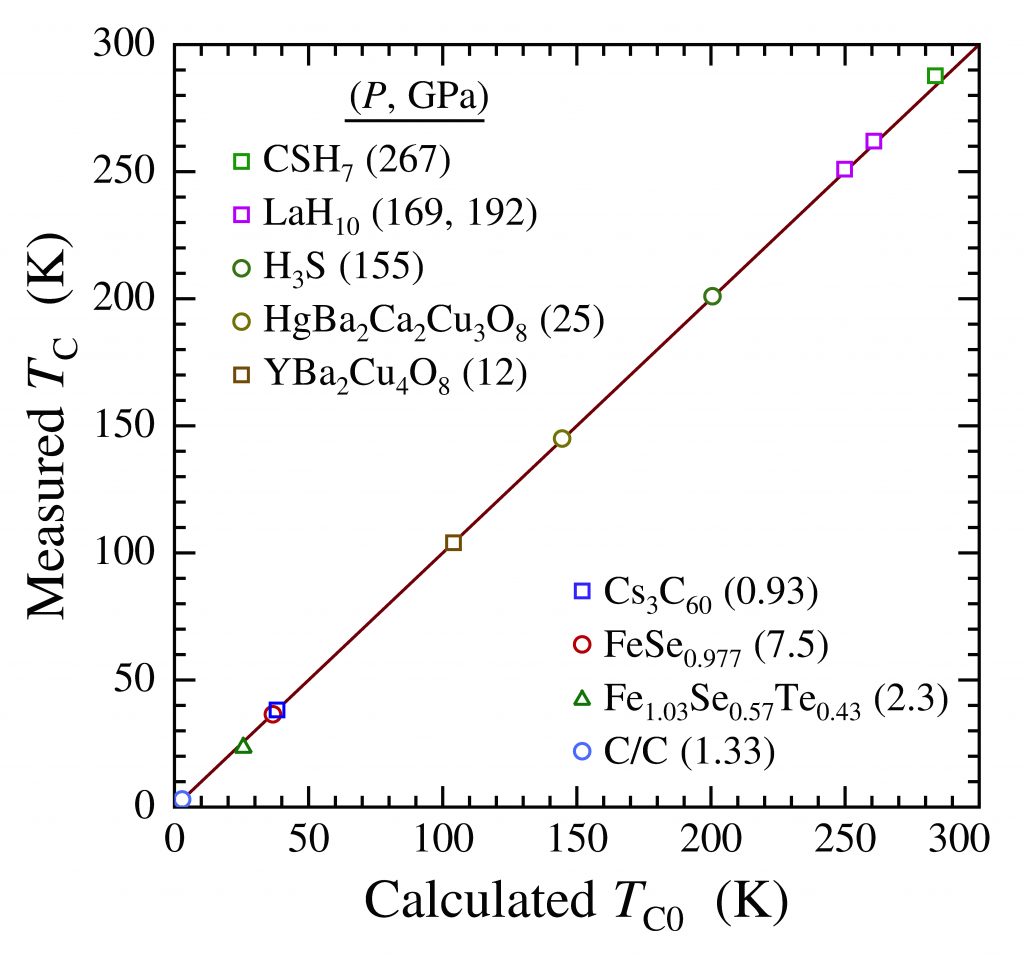
Figure 4. Measured TC vs. calculated TC0 for compressed high-TC superconductors. The solid line represents Eq. (1) in the paper, highlighting the equality between TC and TC0.
Dale R. Harshman and Anthony T. Fiory, Journal of Applied Physics 131, 015105 (2022).