Analysis of Electrical Resistance Data from Snider et al., Nature 586, 373 (2020), Dale R. Harshman and Anthony T. Fiory [arXiv]
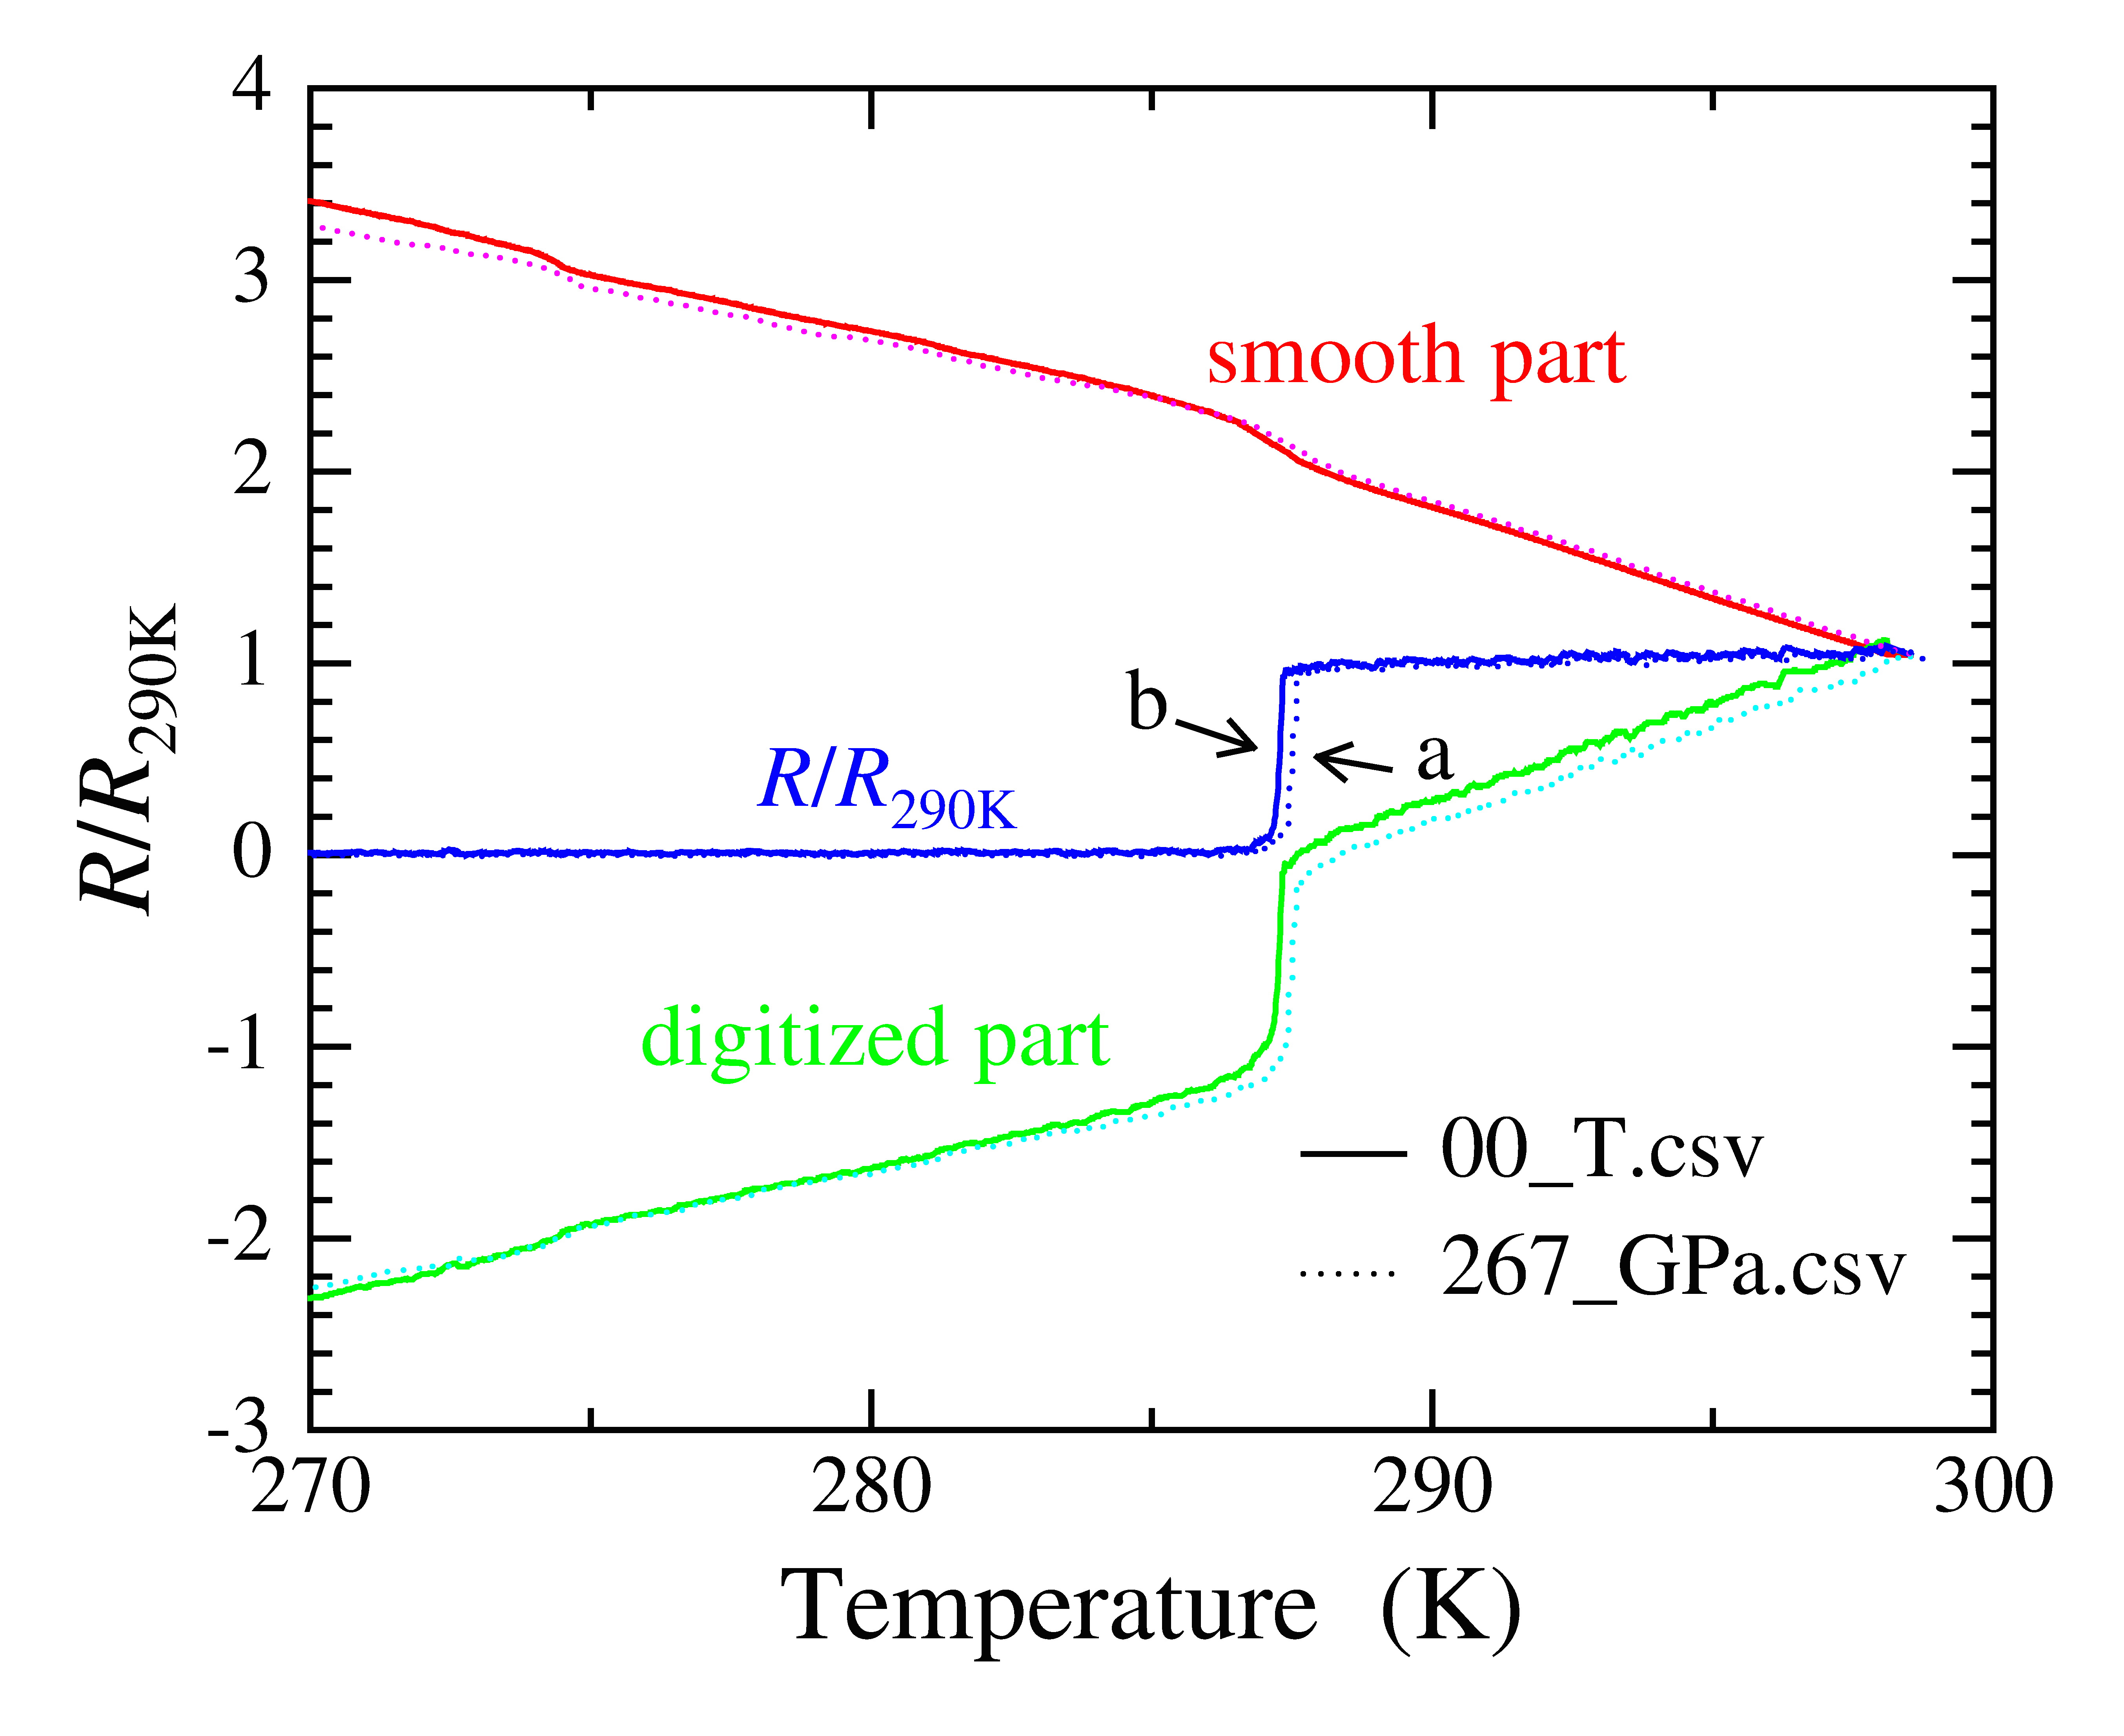
Digital data for the temperature dependence of electrical resistance, which were extracted and analyzed by Hamlin (arXiv:2210.10766v1) from the pdf file published for “Room temperature superconductivity in a carbonaceous sulfur hydride,” show asymmetric serrations in data for 267 GPa in zero magnetic field that comprise smooth and digitized parts. Further analysis shows that the smooth part exhibits a step at the transition of ~16% in magnitude relative to the data. Notably, there is no evidence of asymmetric serrations in extracted data for lower pressures (184–258 GPa) or for 267 GPa in an applied magnetic field (1–9 T). Several questions are raised, the answers to which would help toward resolving these outstanding issues.
Dale R. Harshman and Anthony T. Fiory, arXiv:2212.06237 [cond-mat.supr-con] (2022).