Superconducting I43m CSH7 Model Applied to Resistive Transition Temperature Data for Compressed C-S-H at High Pressure, Dale R. Harshman and Anthony T. Fiory [arXiv_3]
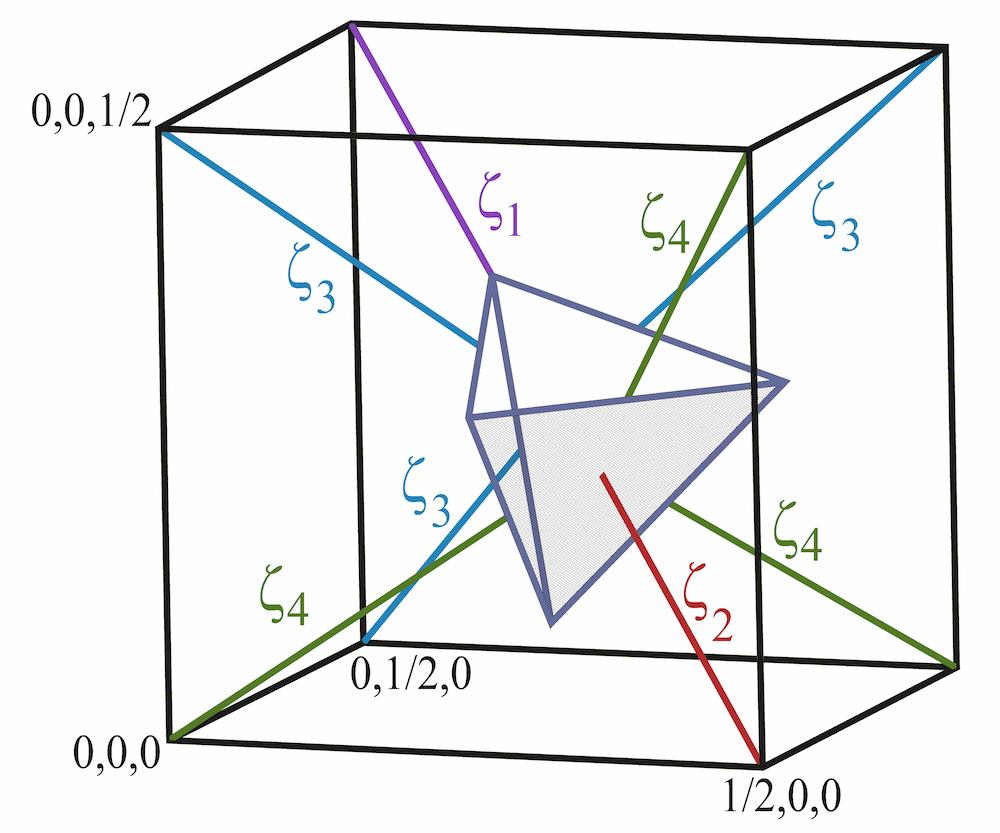
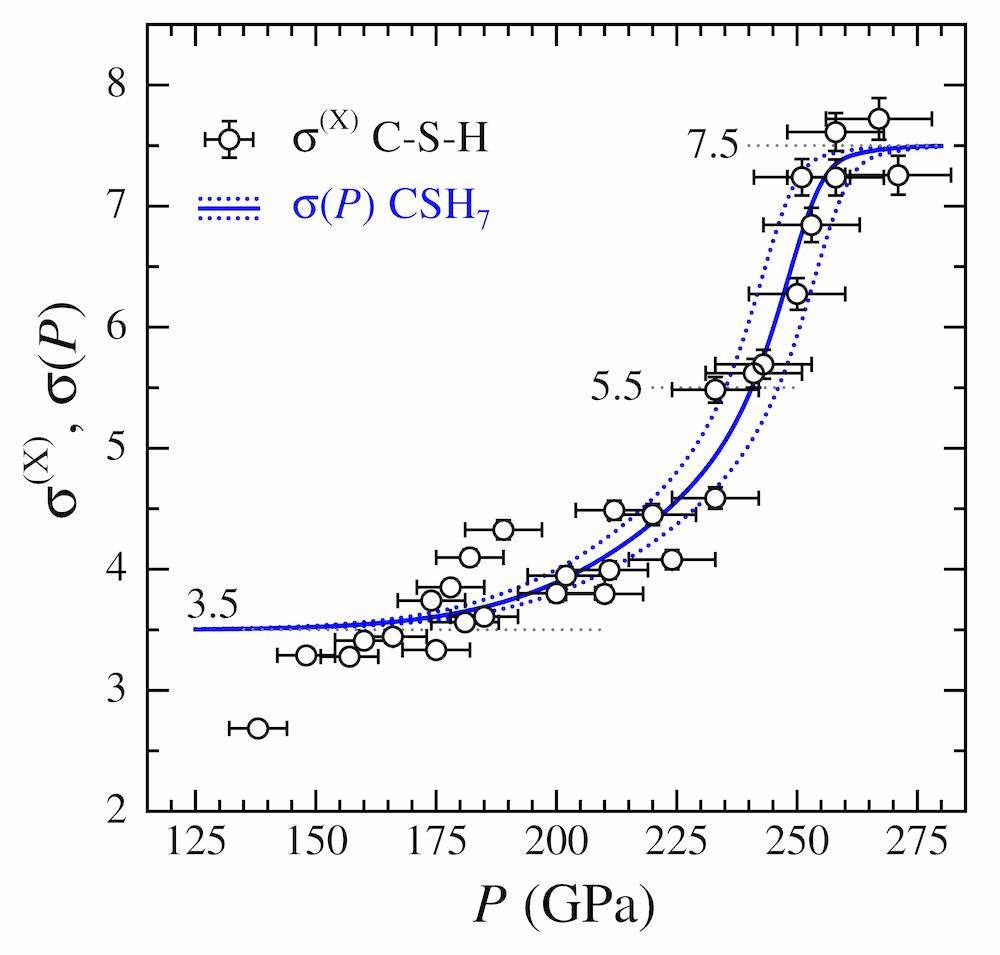
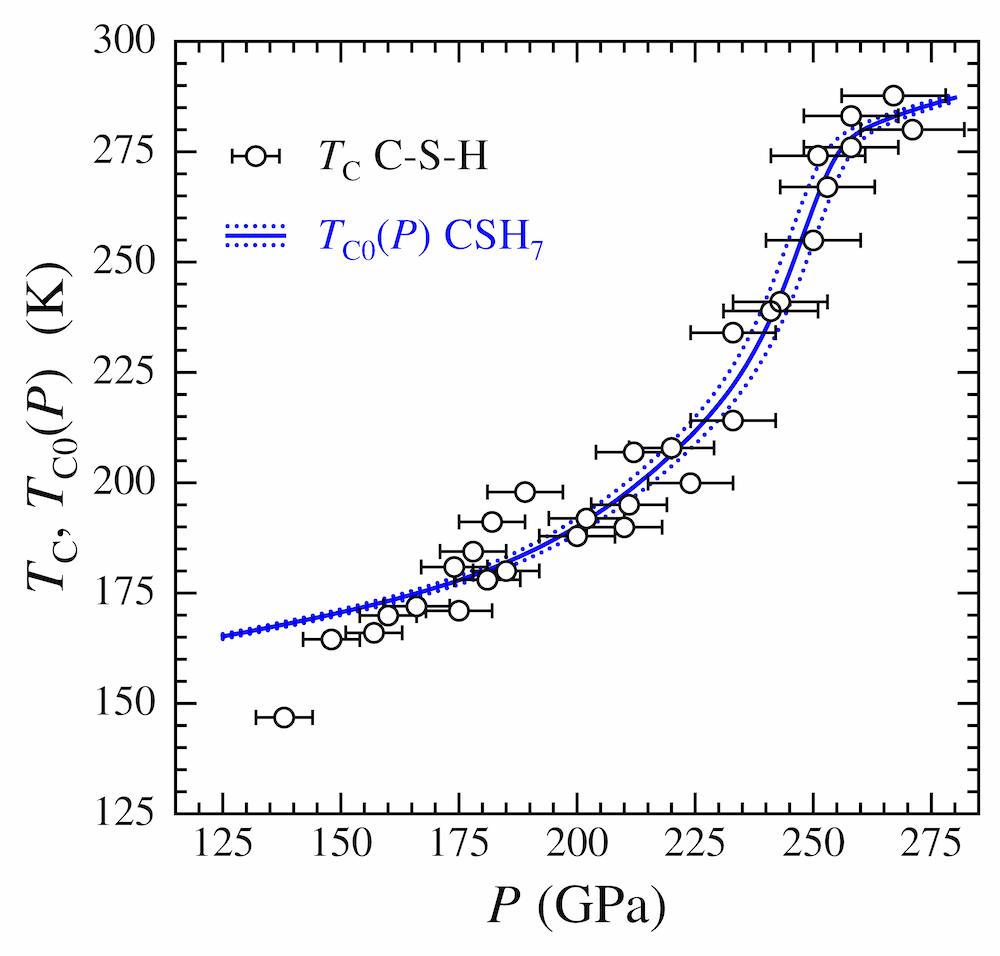
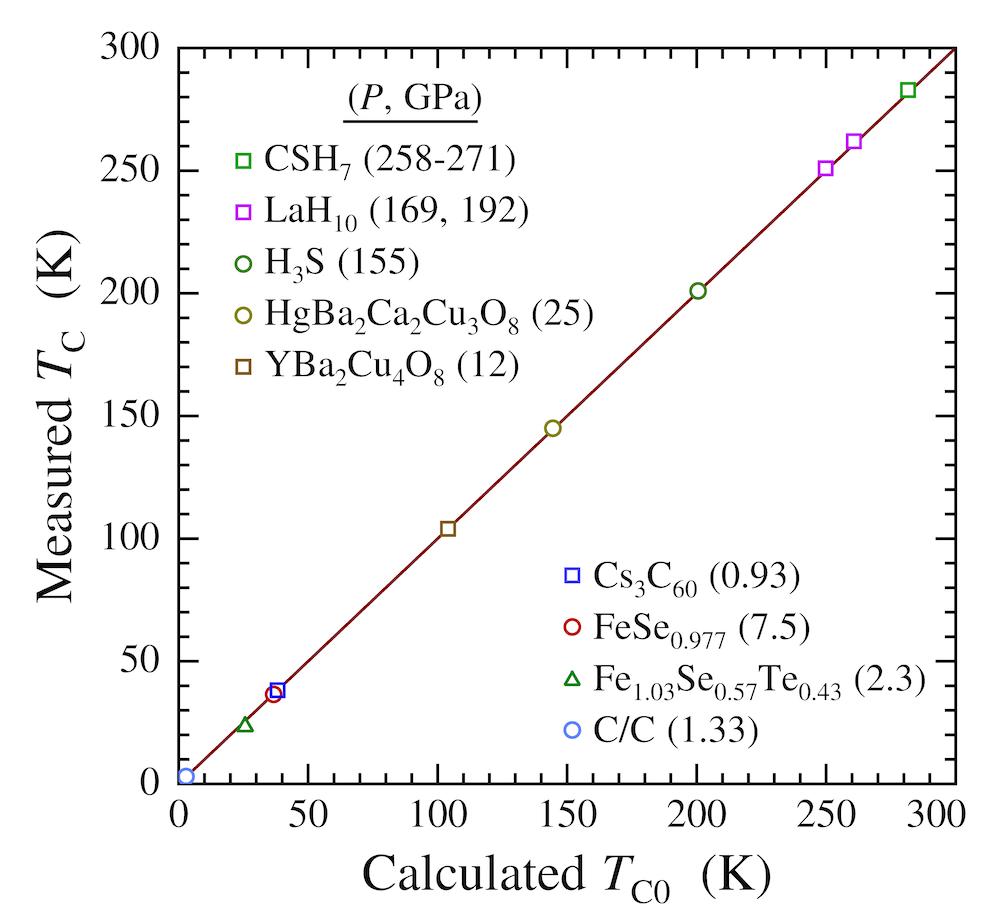
This article updates version 1 by restricting consideration to only the resistive data and excluding the questioned 287.7-K datum reported for carbonaceous sulfur hydride in Snider et al., Nature 585, 373 (2020). The superconducting transitions are considered in terms of the theoretically-discovered compressed I43m CSH7 structure of Sun et al., Phys. Rev. B 101, 174102 (2020), which comprises a sublattice similar to Im3m H3S with CH4 intercalates. Positing an electronic genesis of the superconductivity, a model is presented in analogy with earlier work on superconductivity in Im3m H3S, in which pairing is induced via purely electronic Coulomb interactions across the mean distance ζ between the S and H4 tetrahedra enclosing C. Theoretical superconducting transition temperatures for I43m CSH7 are derived as TC0 = (2/3)1/2σ1/2β/aζ, where β = 1247.4 Å2K is a universal constant, σ is the participating charge fraction, and a is the lattice parameter. Analysis suggests persistent bulk superconductivity with a pressure-dependent σ, increasing from σ = 3.5, determined previously for Im3m H3S, to σ = 7.5 at high pressure owing to additionally participating C-H bond electrons. With an and ζ determined by theoretical structure, calculations of TC0 at the highest pressures, 258 and 271 GPa, are in agreement with resistive transitions to within an overall uncertainty of ± 3.5 K.
Dale R. Harshman and Anthony T. Fiory, arXiv:2201.01860v3 [cond-mat.supr-con] (2023).