Superconducting Interaction Charge in Thallium-Based High-TC Cuprates: Roles of cation oxidation state and electronegativity, D. R. Harshman and A. T. Fiory [arXiv]
Superconductivity in the Tl-based cuprates encompasses a notably broad range of measured optimal transition temperatures TC0, ranging from lowest in the charge-depleted Tl-1201 compounds (Tl1–x(Ba/Sr)1+yLa1–yCuO5–δ), such as Tl0.7LaSrCuO5 (37 K) and TlBa1.2La0.8CuO5 (45.4 K), to highest in the Tl-1223 compound TlBa2Ca2Cu3O9±δ (133.5 K). Seven Tl-based cuprates are considered and compared using the model of superconductive pairing via electronic interactions between two physically separated charge reservoirs, where TC0 ∝ (ση/A)1/2 ζ–1 is determined by the superconducting interaction charge fraction σ the number η of CuO2 layers, and the basal-plane area A, each per formula unit, and the transverse distance ζ between interacting layers. Herein it is demonstrated that σ follows from the elemental electronegativity and the oxidation state of Tl, and other structurally analogous cations. The comparatively lower elemental electronegativity of Tl, in conjunction with its oxidation state, explains the higher σ and TC0 values in the Tl-based compounds relative to their Bi-based cuprate homologues. A derivation of σ is introduced for the optimal Tl2Ba2Caη–1CuηO2η+2 (for η = 1, 2, 3) compounds, which exhibit a Tl oxidation state at or near +3, obtaining the fundamental value σ0 = 0.228 previously established for YBa2Cu3O6.92. Also reported is the marked enhancement in σ associated with Tl+1 and analogous inner-layer cations relative to higher-valence cations. For a model proposition of σ = σ0, the fractional Tl+1 content of the mixed-valence compound, TlBa2Ca2Cu3O9±δ, is predicted to be 1/3 at optimization, in agreement with existing data. Charge depletion is illustrated for the two Tl-1201 compounds, where σ < σ0 values are determined according to substitution of Ba+2 or Sr+2 by La+3, and/or Tl depletion. Additionally, statistical analysis of calculated and experimental transition temperatures of 48 optimal superconductors shows an absence of bias in determining σ, A, and ζ.
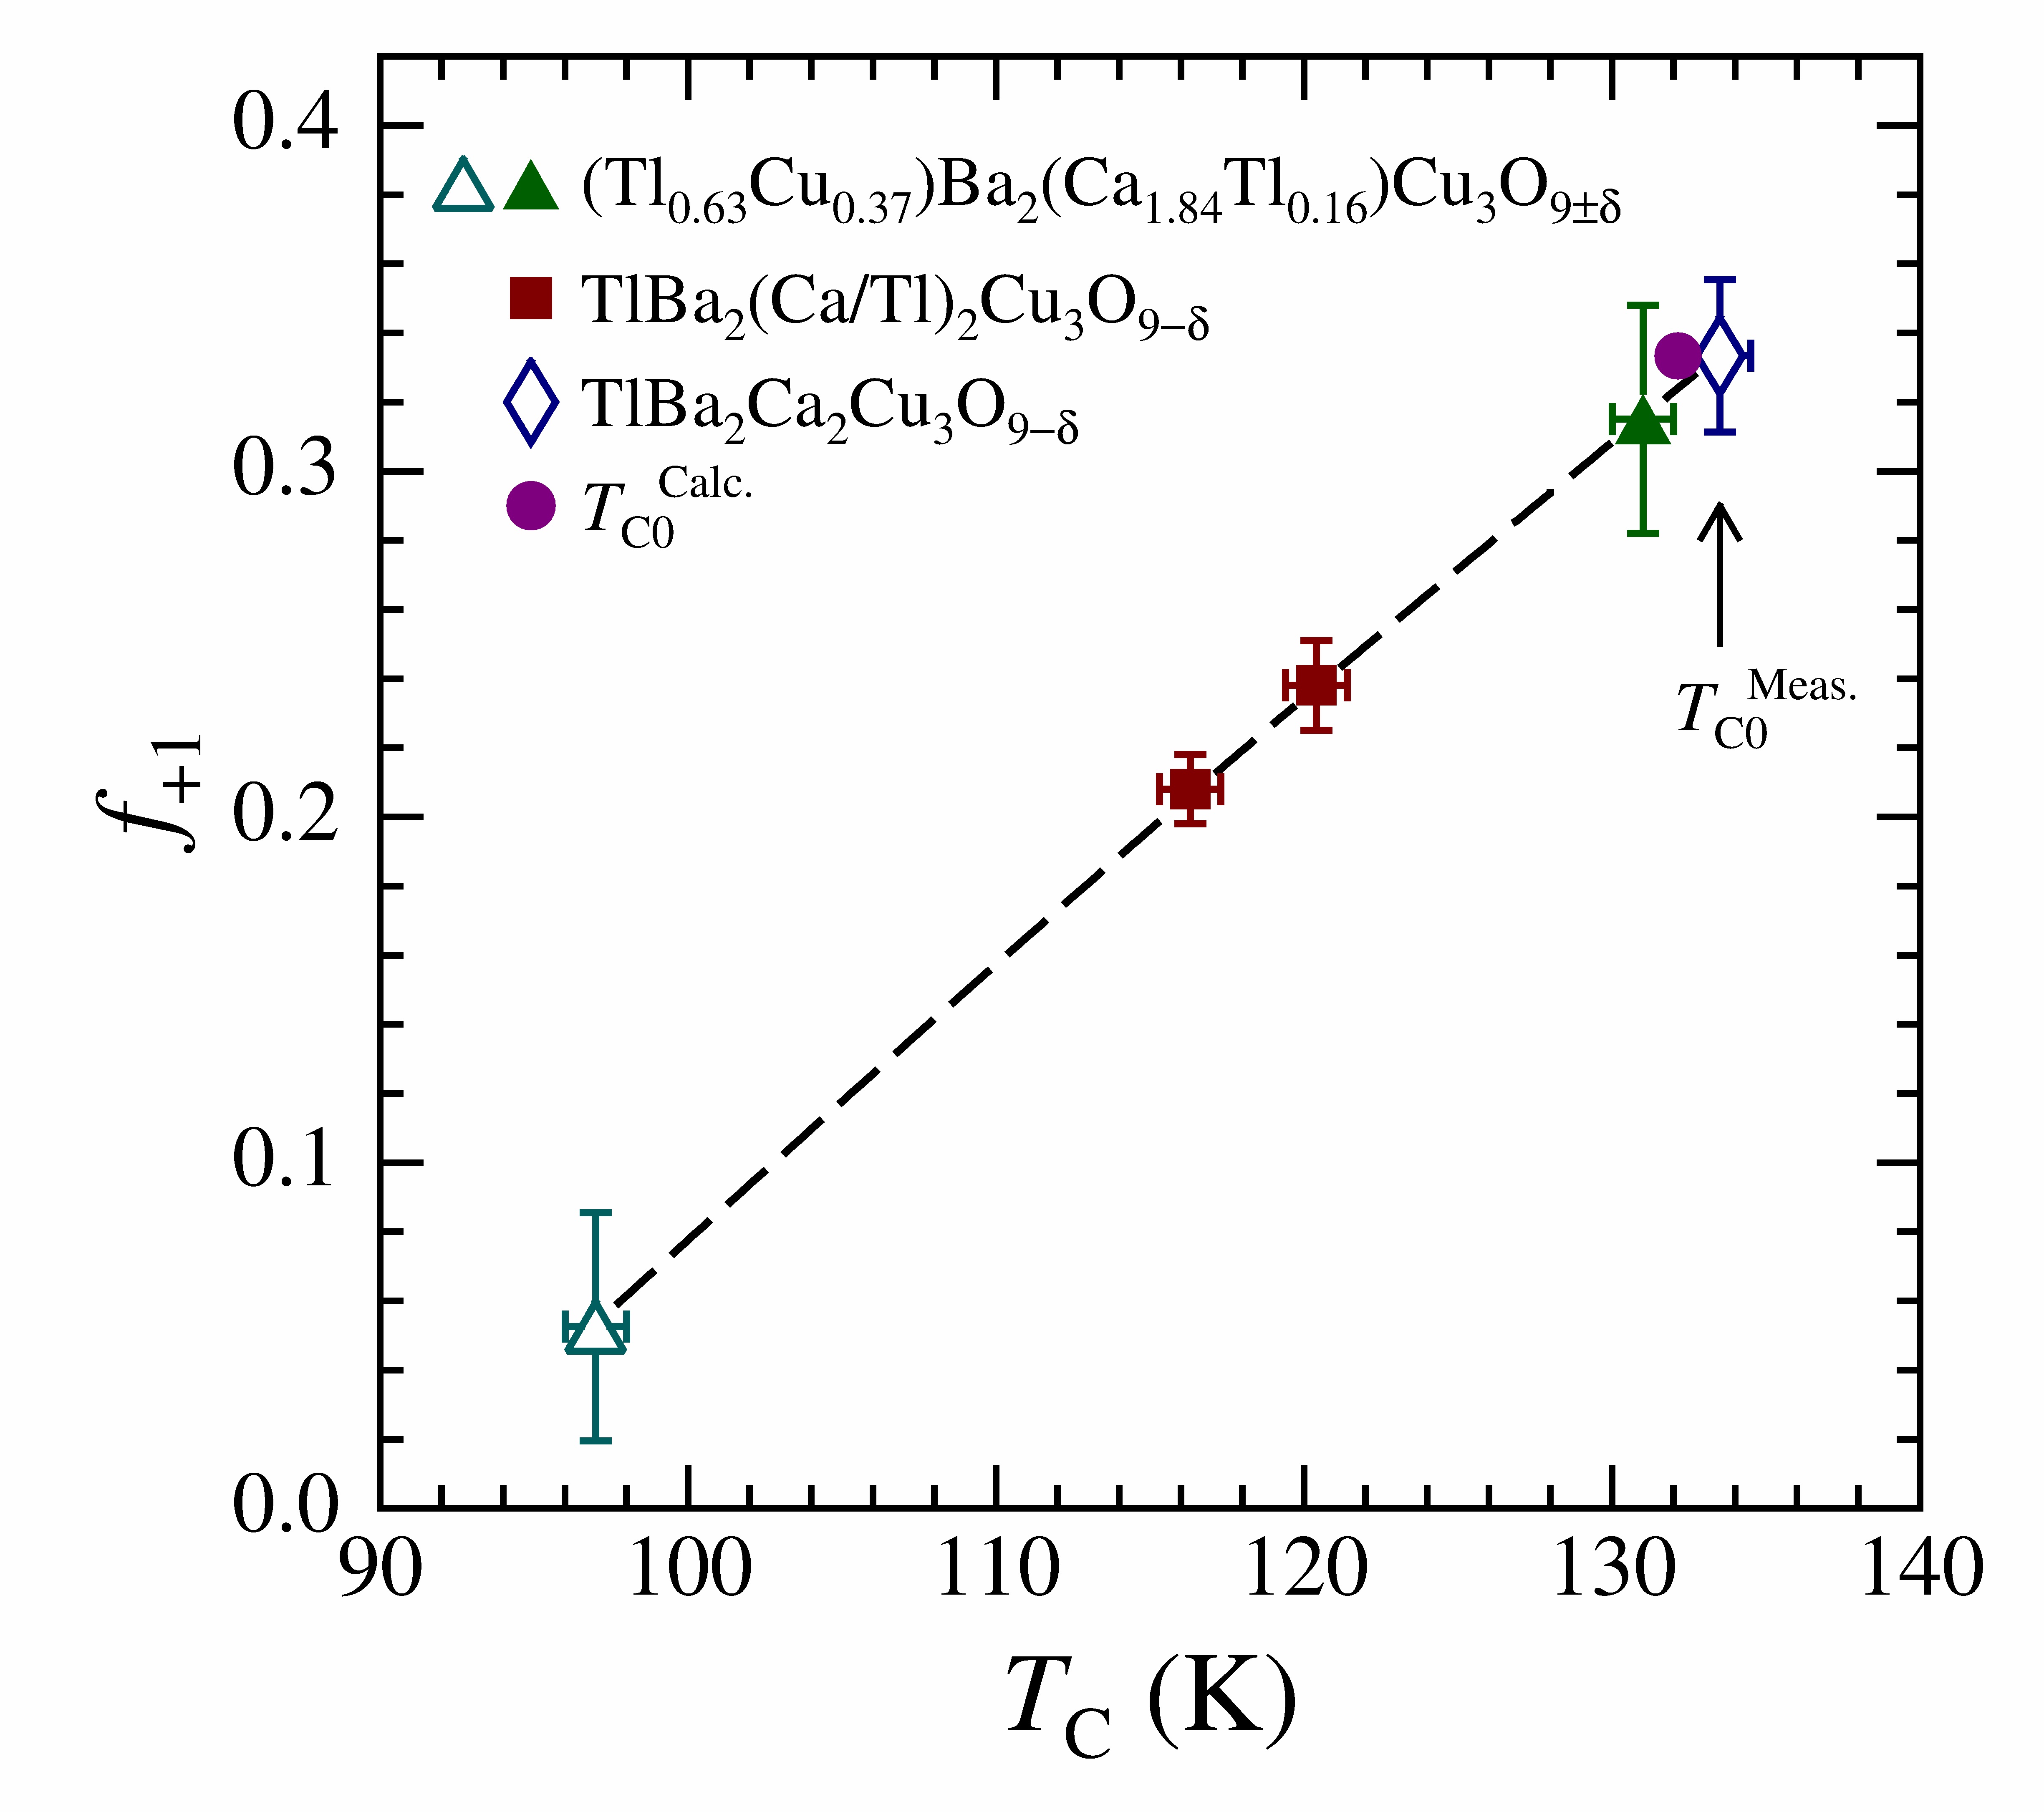 Plot of Tl+1 fraction f+1 versus measured TC for as-synthesized and annealed (Tl1–xCux)Ba2(Ca/Tl)2Cu3O9±δ (open and filled triangles, respectively) [47], TlBa2(Ca/Tl)2Cu3O9–δ (filled squares) [45, 46], and TlBa2Ca2Cu3O9–δ (open diamond) [49]; the dashed line through the data represents the trend. The filled circle denotes calculated TC0Calc. for f+1 = 1/3 predicted for TlBa2Ca2Cu3O9–δ with measured TC0Meas. indicated. |
 Cumulative number distribution for the differences between measured TC0Meas. and calculated TC0Calc. for the 48 compounds listed in Table 1 and represented by symbols indicated in legend. Curve is the modeled error function distribution of fitted width 1.31(2) K, as discussed in the text. |
Dale R. Harshman and Anthony T. Fiory, J. Phys. Chem. Solids 85, 106 (2015).