High-TC Superconductivity Originating from Interlayer Coulomb Coupling in Gate-Charged Twisted Bilayer Graphene Moiré Superlattices, D. R. Harshman and A. T. Fiory [arXiv]
Unconventional superconductivity in bilayer graphene has been reported for twist angles θ near the first magic angle and charged electrostatically with holes near half filling of the lower flat bands. A maximum superconducting transition temperature TC ≈ 1.7 K was reported for a device with θ = 1.05° at ambient pressure and a maximum TC ≈ 3.1 K for a device with θ = 1.27° under 1.33 GPa hydrostatic pressure. A high-TC model for the superconductivity is proposed herein, where pairing is mediated by Coulomb coupling between charges in the two graphene sheets. The expression derived for the optimal transition temperature, TC0 = kB−1Λ(|nopt − n0|/2)1/2e2/ζ, is a function of mean bilayer separation distance ζ, measured gated charge areal densities nopt and n0 corresponding to maximum TC and superconductivity onset, respectively, and the length constant Λ = 0.00747(2) Å. Based on existing experimental carrier densities and theoretical estimates for ζ, TC0 = 1.94(4) K is calculated for the θ = 1.05° ambient-pressure device and TC0 = 3.02(3) K for the θ = 1.27° pressurized device. Experimental mean-field transition temperatures TCmf = 1.83(5) K and TCmf = 2.86(5) K are determined by fitting superconducting fluctuation theory to resistance transition data for the ambient-pressure and pressurized devices, respectively; the theoretical results for TC0 are in remarkable agreement with these experimental values. Corresponding Berezinskii-Kosterlitz-Thouless temperatures TBKT of 0.96(3) K and 2.2(2) K are also determined and interpreted.
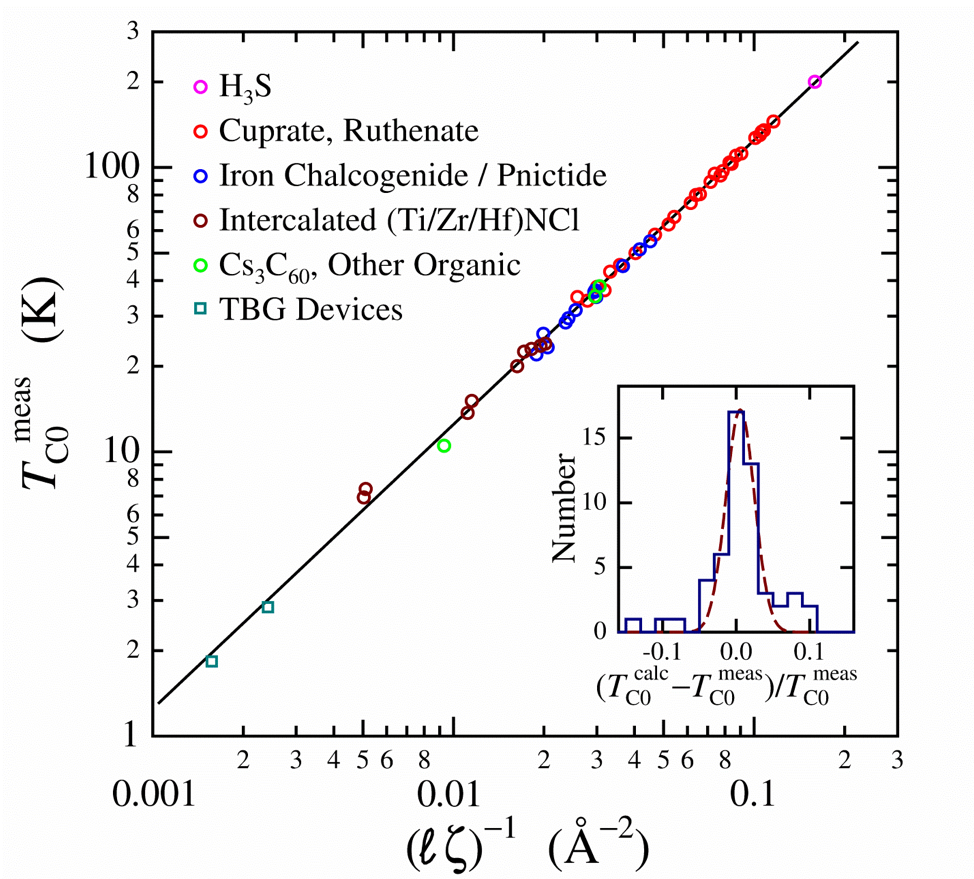
TC0meas versus (ℓζ)–1 for TBG devices M2 and D2 (two square symbols) compared to 51 other optimal high-TC superconductors: cuprates and ruthenates; iron pnictides and chalcogenides; intercalated group-4-metal nitride-chlorides; and other organics. The black solid line represents TC0. Inset shows the distribution (histogram bin width 0.02) of the fractional difference (TC0calc – TC0meas)/TC0meas for the 53 optimal high-TC superconductors, including TBG devices M2 and D2. A fitted normal distribution (dashed curve) is provided for comparison.
Dale R. Harshman and Anthony T. Fiory, Journal of Superconductivity and Novel Magnetism 33, 367 (2020).