High-TC Superconductivity in Cs3C60 Compounds Governed by Local Cs-C60 Coulomb Interactions, D. R. Harshman and A. T. Fiory [arXiv]
Unique among alkali-doped A3C60 fullerene compounds, the A15 and fcc forms of Cs3C60 exhibit superconducting states varying under hydrostatic pressure with highest transition temperatures at TCmeas = 38.3 and 35.2 K, respectively. Herein it is argued that these two compounds under pressure represent the optimal materials of the A3C60 family, and that the C60-associated superconductivity is mediated through Coulombic interactions with charges on the alkalis. A derivation of the interlayer Coulombic pairing model of high-TC superconductivity employing non-planar geometry is introduced, generalizing the picture of two interacting layers to an interaction between charge reservoirs located on the C60 and alkali ions. The optimal transition temperature follows the algebraic expression, TC0 = (12.474 nm2 K)/ℓζ, where ℓ relates to the mean spacing between interacting surface charges on the C60 and ζ is the average radial distance between the C60 surface and the neighboring Cs ions. Values of TC0 for the measured cation stoichiometries of Cs3–xC60 with x » 0 are found to be 38.19 and 36.88 K for the A15 and fcc forms, respectively, with the dichotomy in transition temperature reflecting the larger ζ and structural disorder in the fcc form. In the A15 form, modeled interacting charges and Coulomb potential e2/ζ are shown to agree quantitatively with findings from nuclear-spin relaxation and mid-infrared optical conductivity. In the fcc form, suppression of TCmeas below TC0 is ascribed to native structural disorder. Phononic effects in conjunction with Coulombic pairing are discussed.
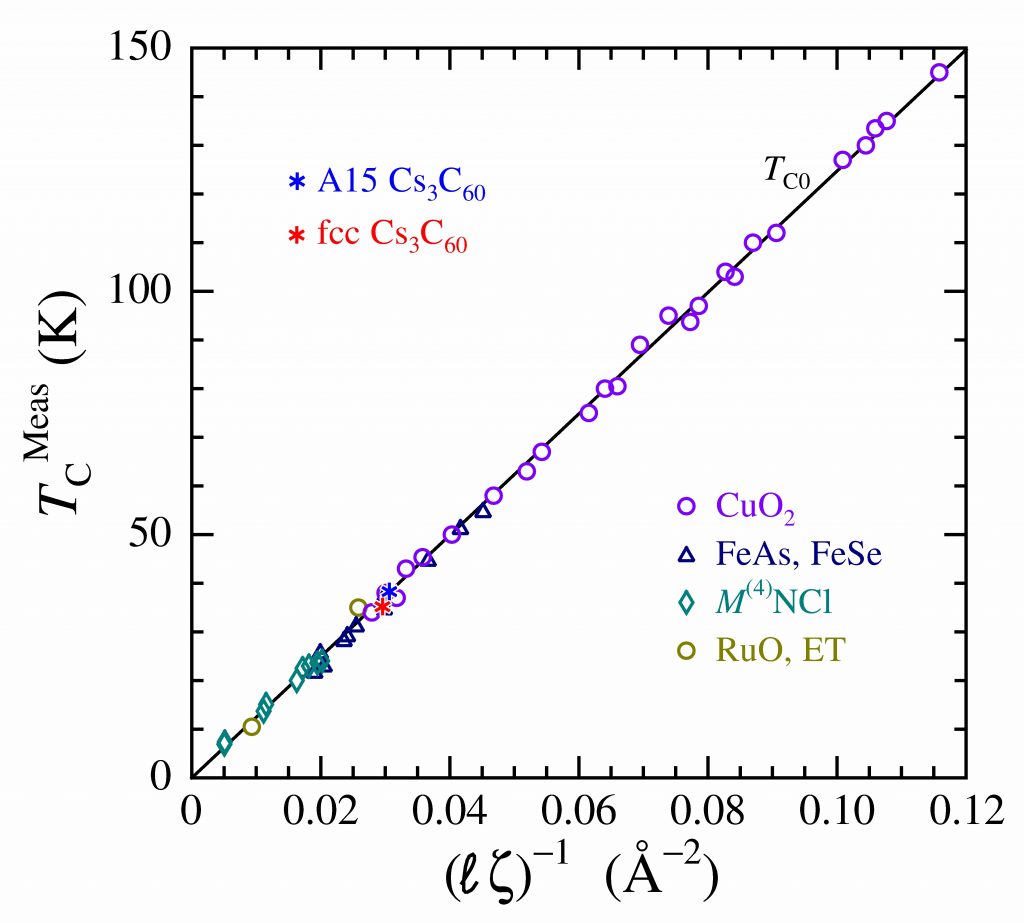 Measured optimal transition temperature TCmeas versus (ℓζ)–1 for A15 Cs2.85(1)C60 and fcc Cs2.901(6)C60 (legend upper left), compared to other high-TC superconductors: cuprates; iron pnictides and chalcogenides; intercalated group-4-metal nitride-chlorides; and RuO- and ET-based compounds (legend lower right). The line represents the theoretical TC0. |
|
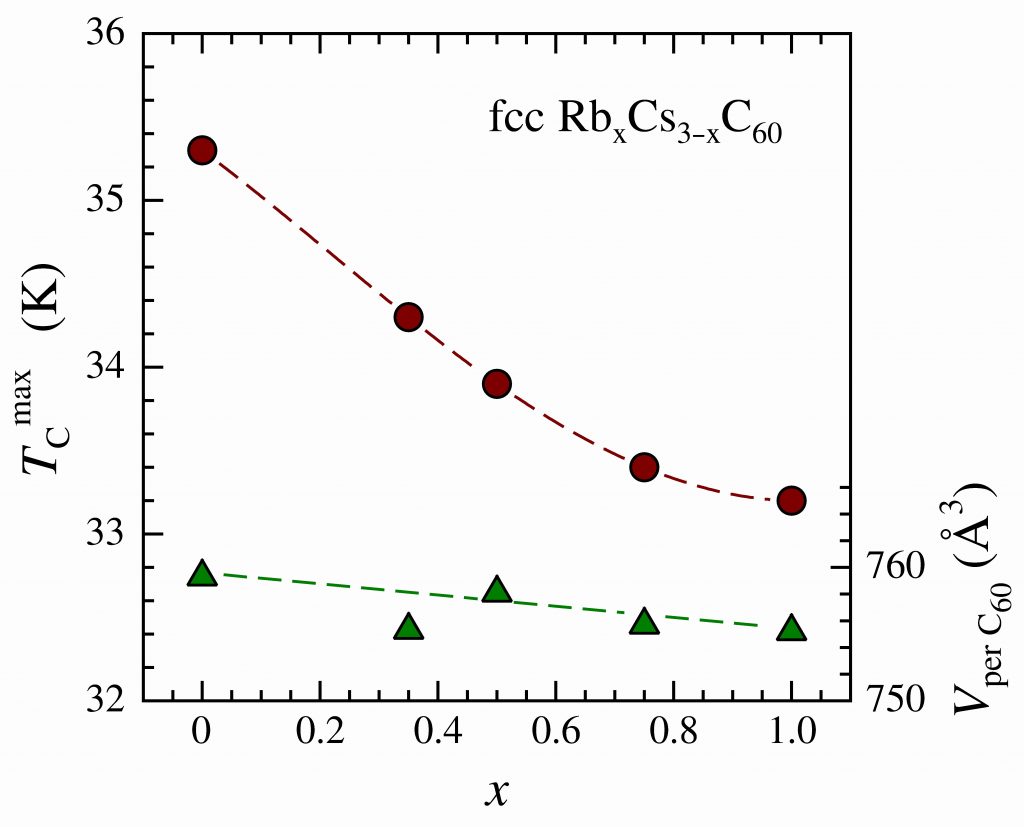 Maximum measured transition temperature TCmax plotted against Rb content x in RbxCs3–xC60 for x = 0 and x = 0.35, 0.5, 0.75 and 1), denoted by circle symbols. Triangles denote corresponding measured Vper C60. Dashed curves are guides to the eye. After Refs. [8] and [13] of paper. |
Dale R. Harshman and Anthony T. Fiory, J. Phys.: Condens. Matter 29, 145602 (2017).