On the Isotope Effect in Compressed Superconducting H3S and D3S, D. R. Harshman and A. T. Fiory [arXiv]
A maximum superconductive transition temperature TC = 203.5 K has recently been reported for a sample of the binary compound tri-hydrogen sulfide (H3S) prepared at high pressure and with room temperature annealing. Measurements of TC for H3S and its deuterium counterpart D3S have suggested a mass isotope effect exponent α with anomalous enhancements for reduced applied pressures. While widely cited for evidence of phonon-based superconductivity, the measured TC is shown to exhibit important dependences on the quality and character of the H3S and D3S materials under study; examination of resistance vs. temperature data shows that variations in TC and apparent α are strongly correlated with residual resistance ratio, indicative of sensitivity to metallic order. Correlations also extend to the fractional widths of the superconducting transitions. Using resistance data to quantify and compensate for the evident materials differences between H3S and D3S samples, a value of α = 0.043 ± 0.140 is obtained. Thus, when corrected for the varying levels of disorder, the experimental upper limit (≤0.183) lies well below α derived in phonon-based theories.
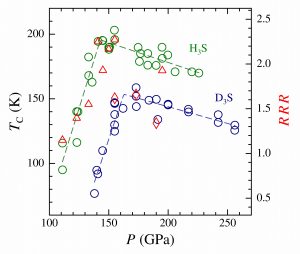 | Transition temperatures TC for H3S (green circles) and D3S (blue circles) vs. applied pressure P with corresponding dashed lines fitted to joined linear trends using equation (1) of the article with parameters in table 1 of the article (left scale). Residual resistance ratios RRR are shown for H3S (red triangles) and D3S (red diamonds) vs. P (right scale). Data are for samples annealed at or above room temperature (see REfs. [1,2] of the article). |
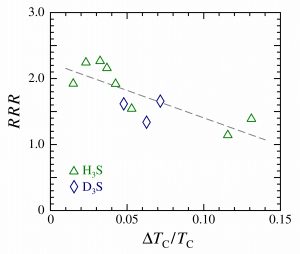 Residual resistance ratio RRR vs. fractional transition width ΔTC/TC for samples of H3S (green triangles) and D3S (blue diamonds). A linearly fitted dashed line is drawn to indicate the trend. | 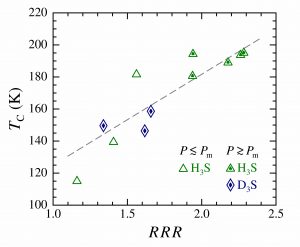 Transition temperature TC vs. residual resistance ratio RRR for H3S (green triangles) and D3S (blue diamonds). The eight symbols with dot fill correspond to data for P ≳ Pm with trend shown by the fitted dashed line. |
Dale R. Harshman and Anthony T. Fiory, Supercond. Sci. and Technol. 30, 045011 (2017).