Theory of high-TC Superconductivity: Transition temperature, D. R. Harshman, A. T. Fiory and J. D. Dow [arXiv]
It is demonstrated that the transition temperature (TC) of high-TC superconductors is determined by their layered crystal structure, bond lengths, valency properties of the ions, and Coulomb coupling between electronic bands in adjacent, spatially separated layers. Analysis of 31 high-TC materials (cuprates, ruthenates, rutheno-cuprates, iron pnictides, organics) yields the universal relationship for optimal compounds, kBTC0 = β/ℓζ, where ℓ is related to the mean spacing between interacting charges in the layers, ζ is the distance between interacting electronic layers, β is a universal constant and TC0 is the optimal transition temperature (determined to within an uncertainty of ± 1.4 K by this relationship). Non-optimum compounds, in which sample degradation is evident, e.g. by broadened superconducting transitions and diminished Meissner fractions, typically exhibit reduced TC < TC0. It is shown that TC0 may be obtained from an average of Coulomb interaction forces between the two layers.
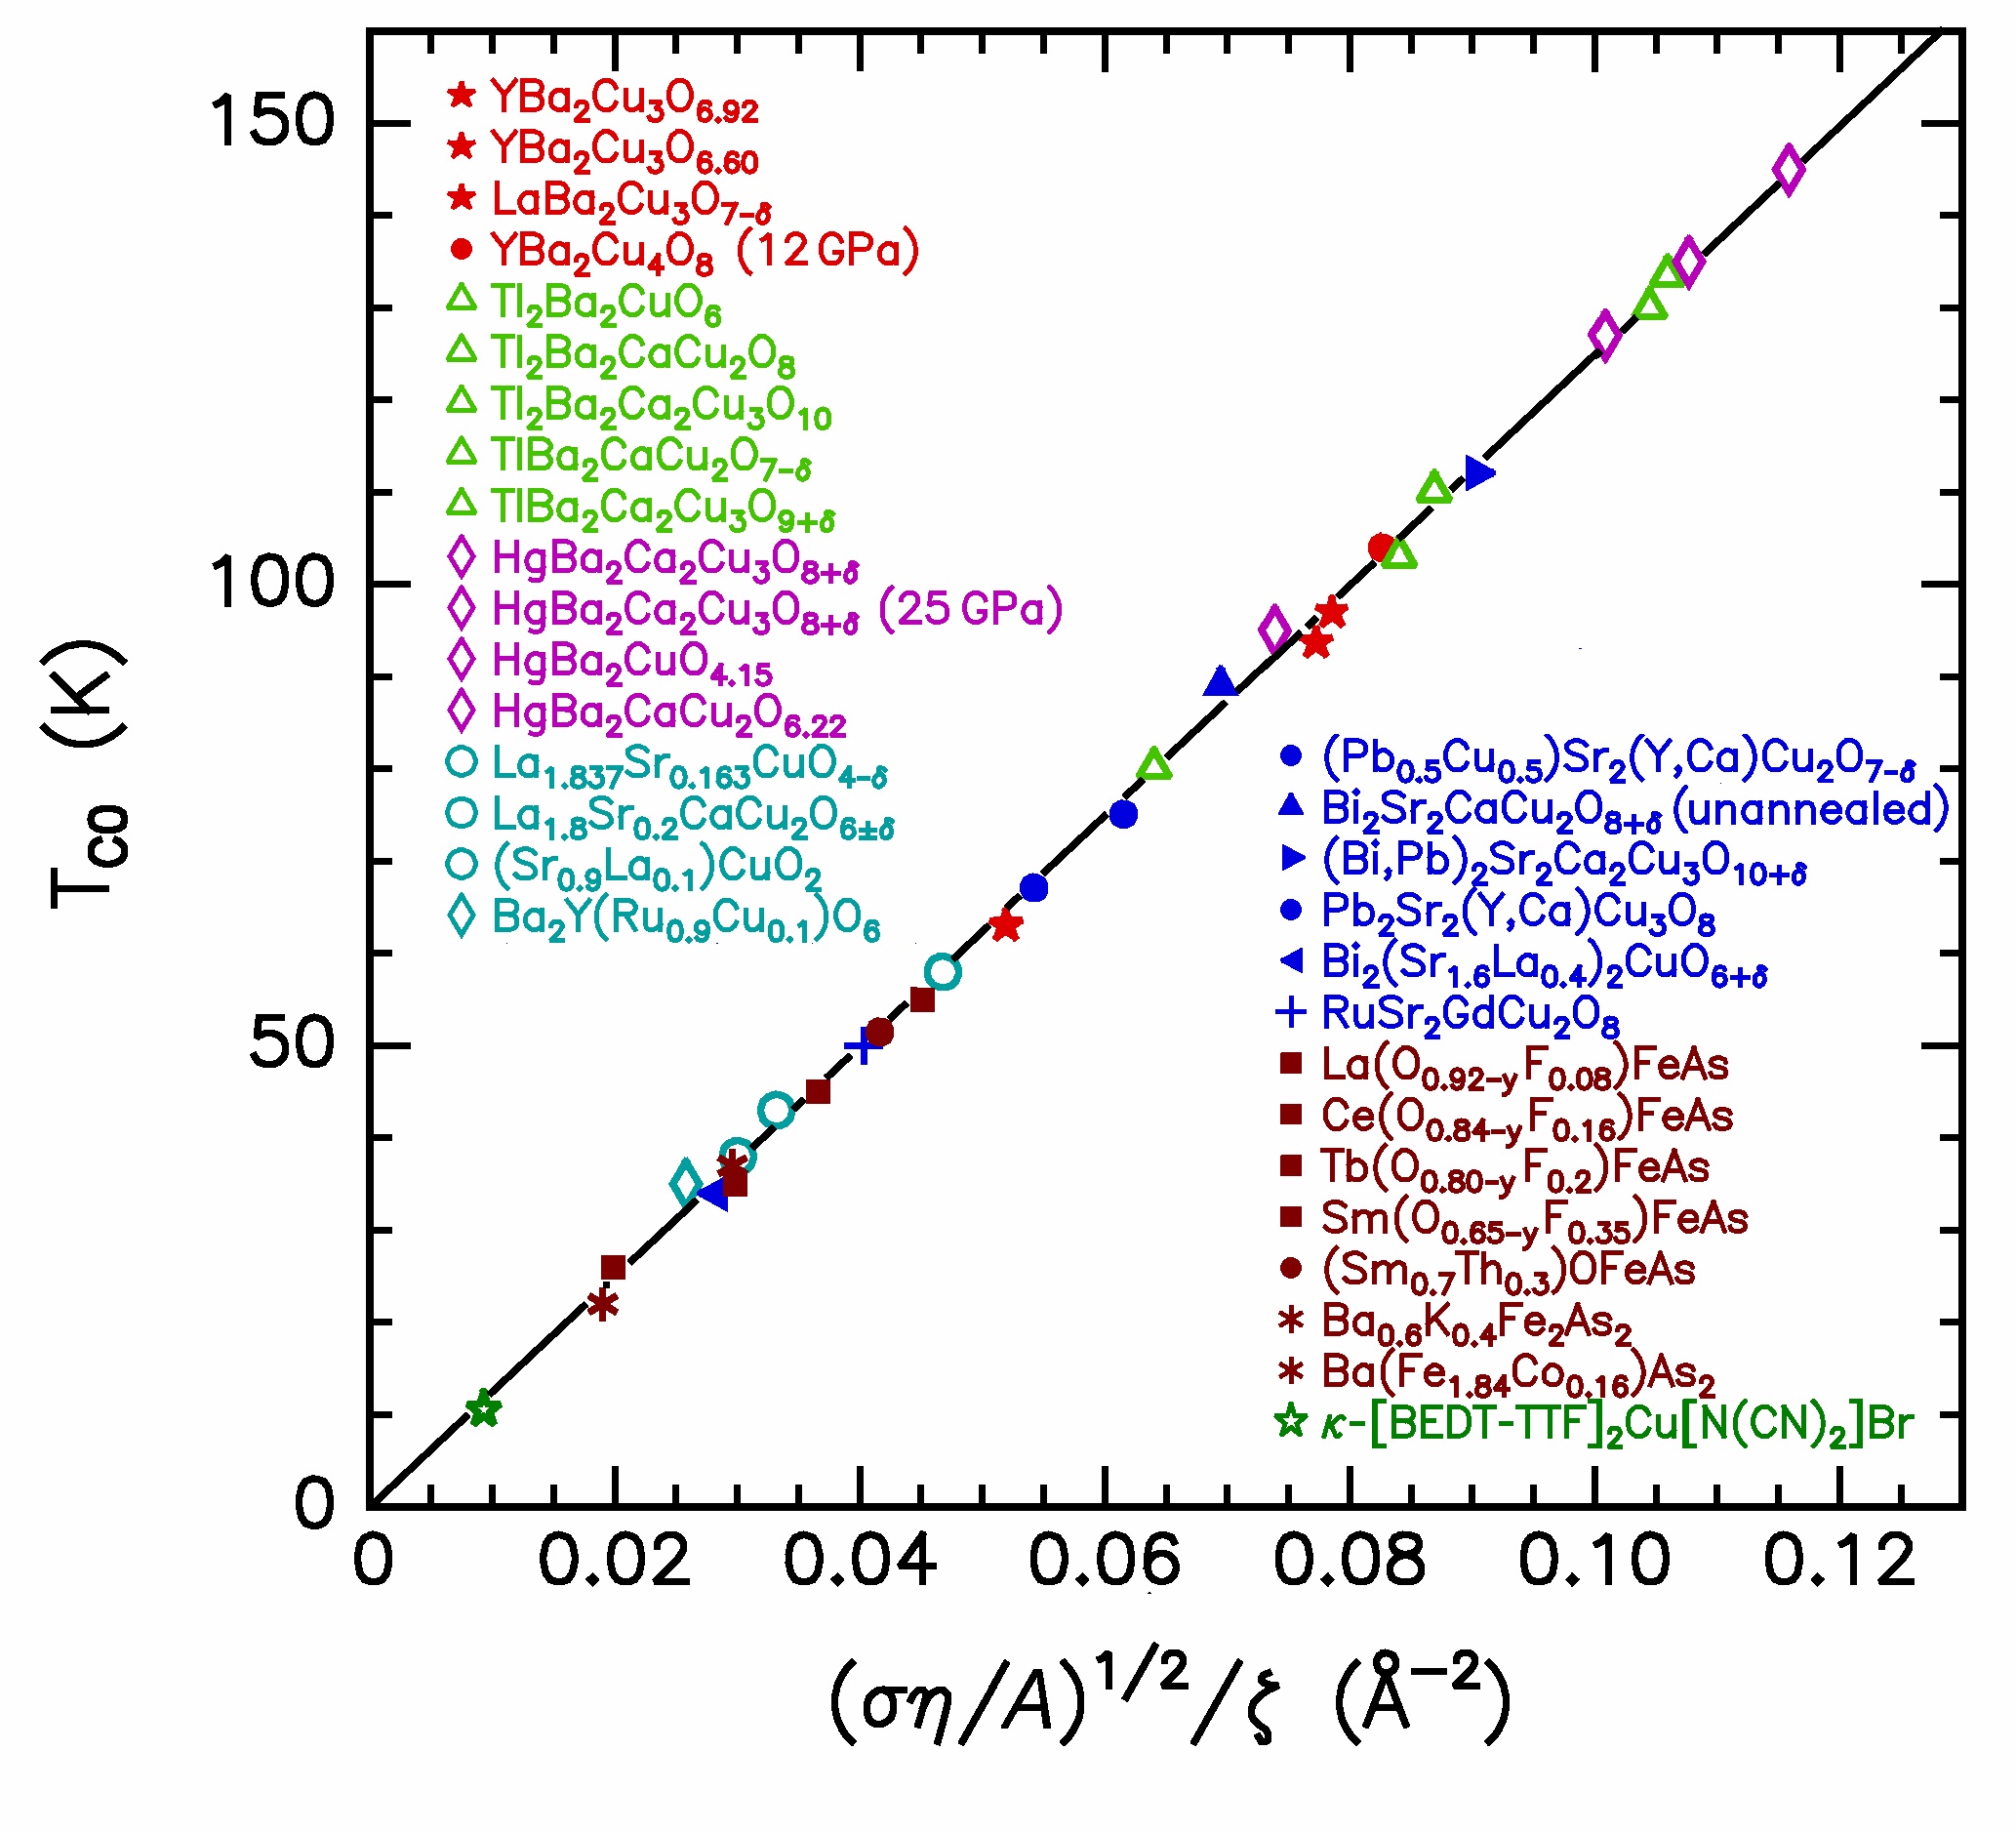 TC0 versus (ση/A)1/2/ζ for the optimal compounds listed in the legend. The solid line corresponds to the theoretical function given in the abstract. The compounds are grouped by families (color) and distinguished by structures (symbols). |
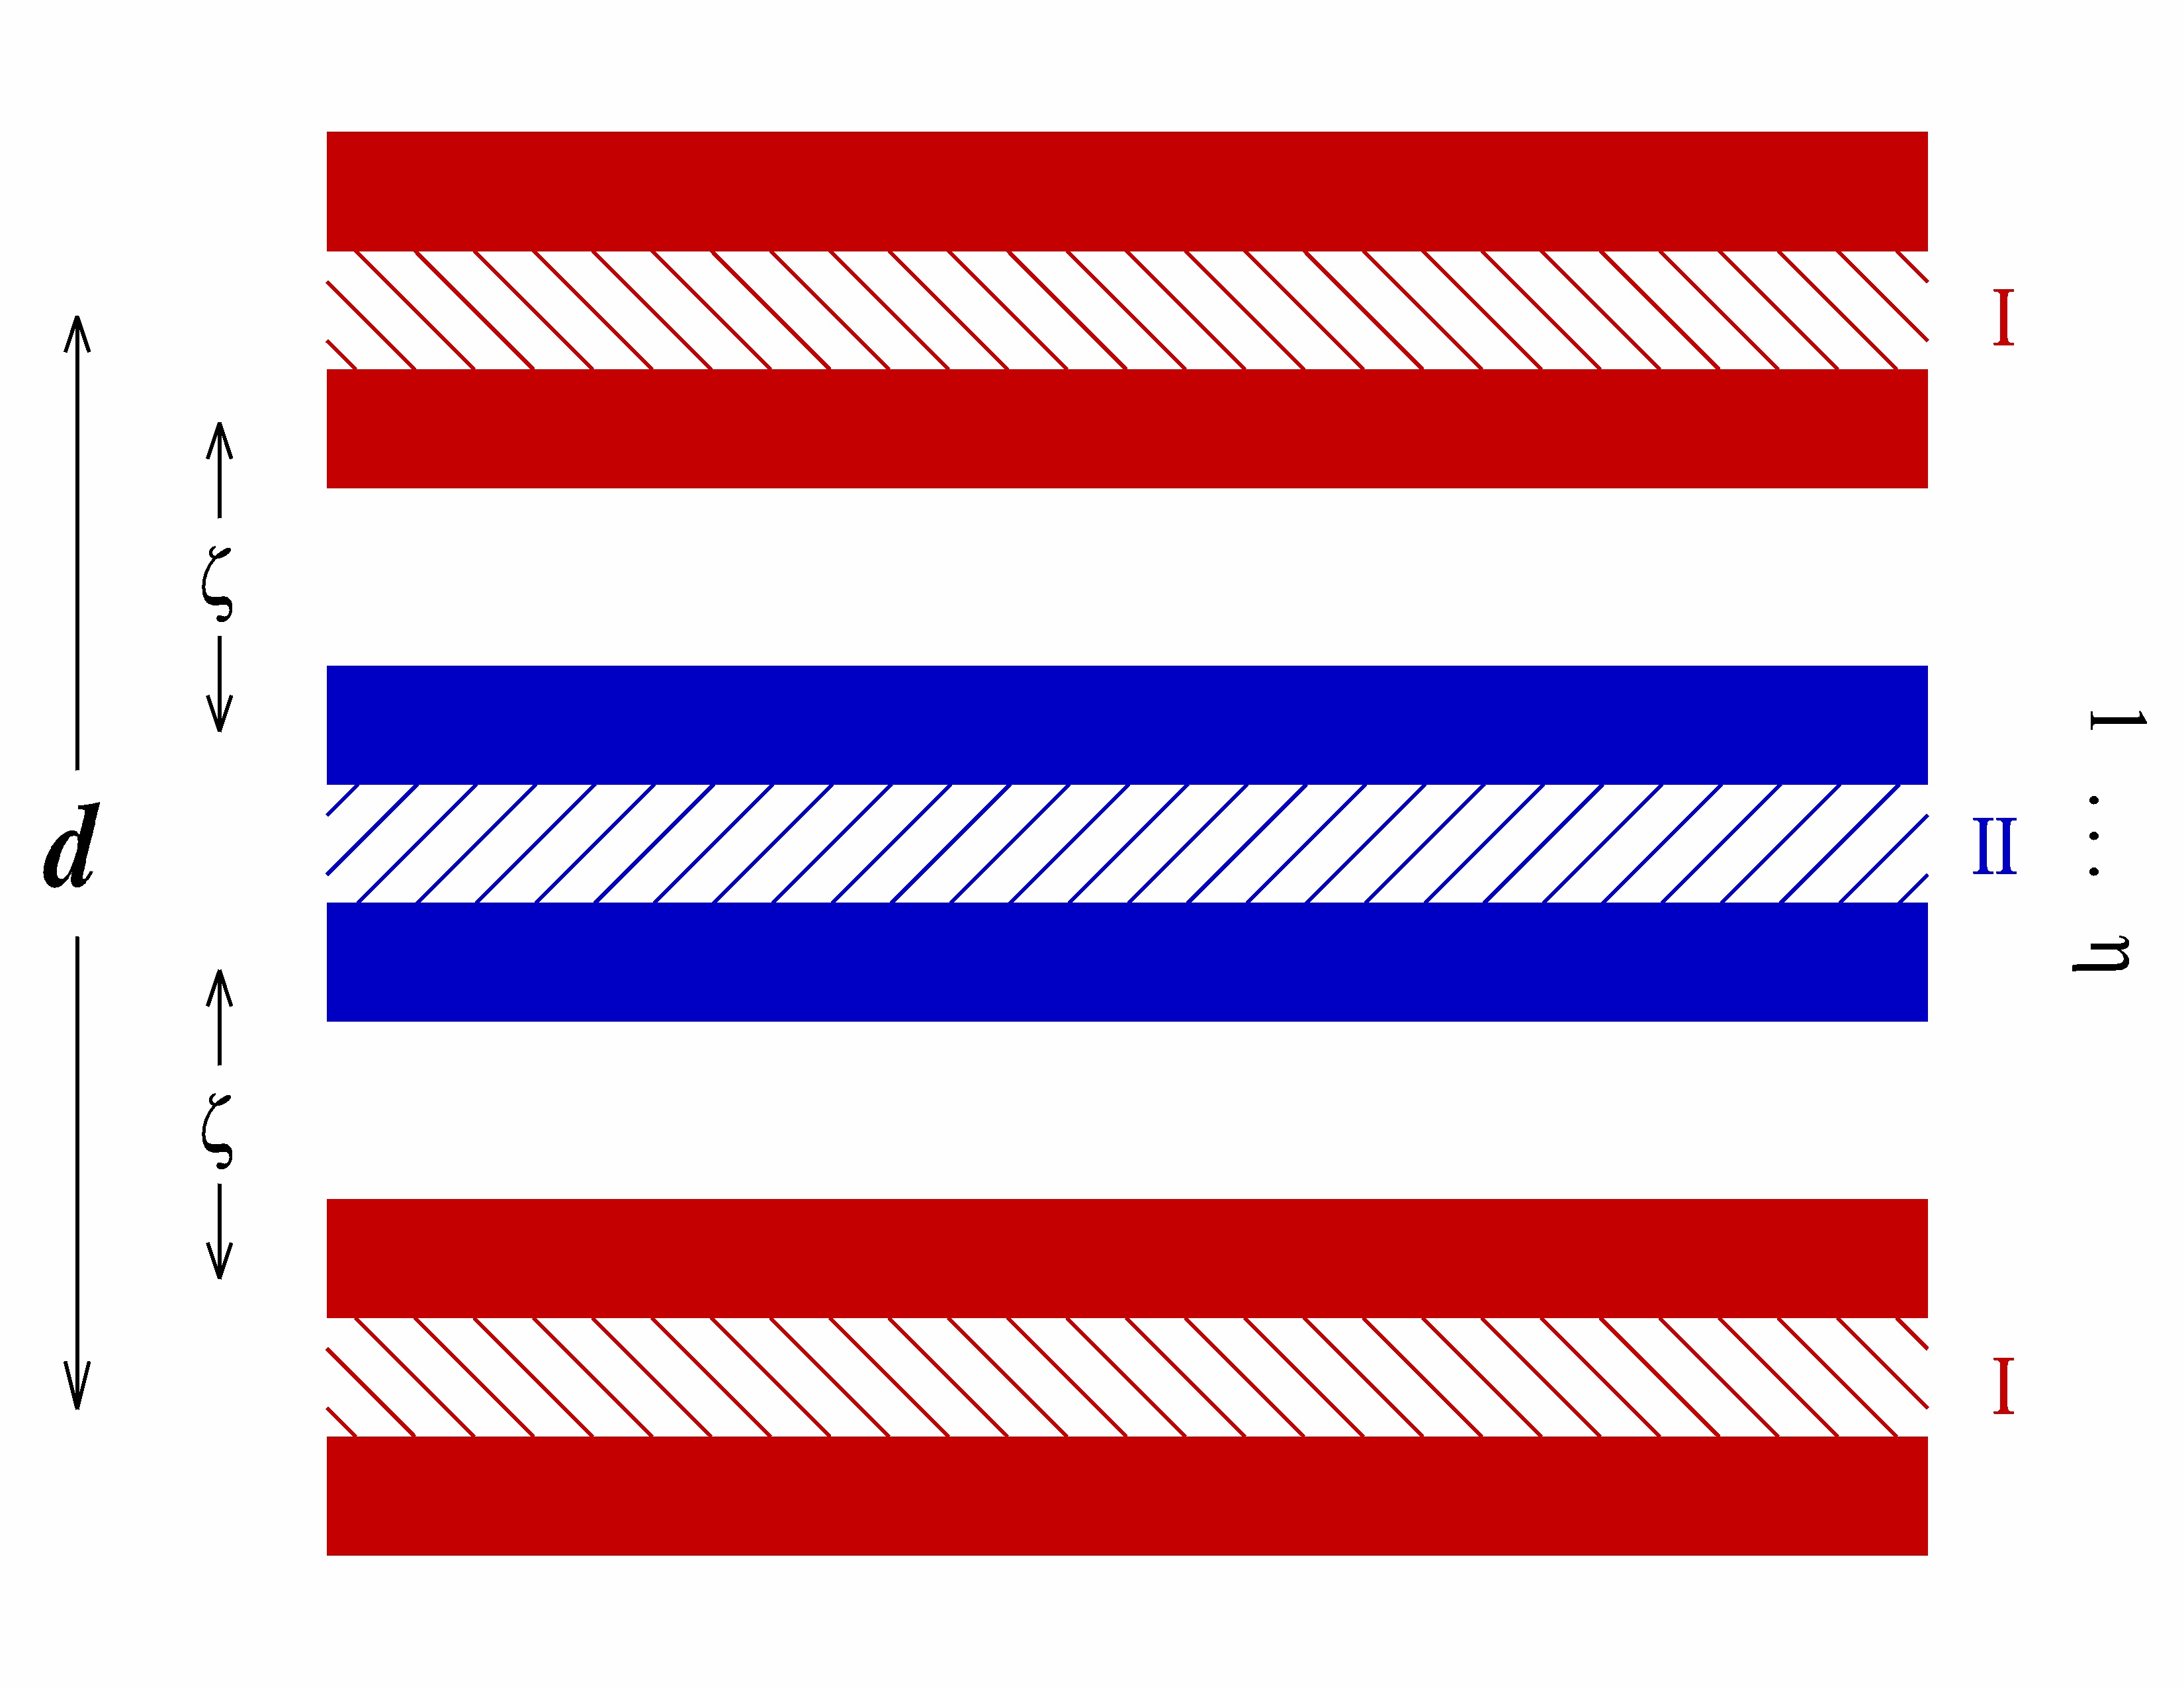 Representative model structure of high-TC superconductors. Cross section view perpendicular to basal plane of periodic electronic layers of types I (red, depicted here with ν = 2) and II (blue). ζ is the separation between adjacent layers of opposite type; η is number of type II layers; d is the periodicity. |
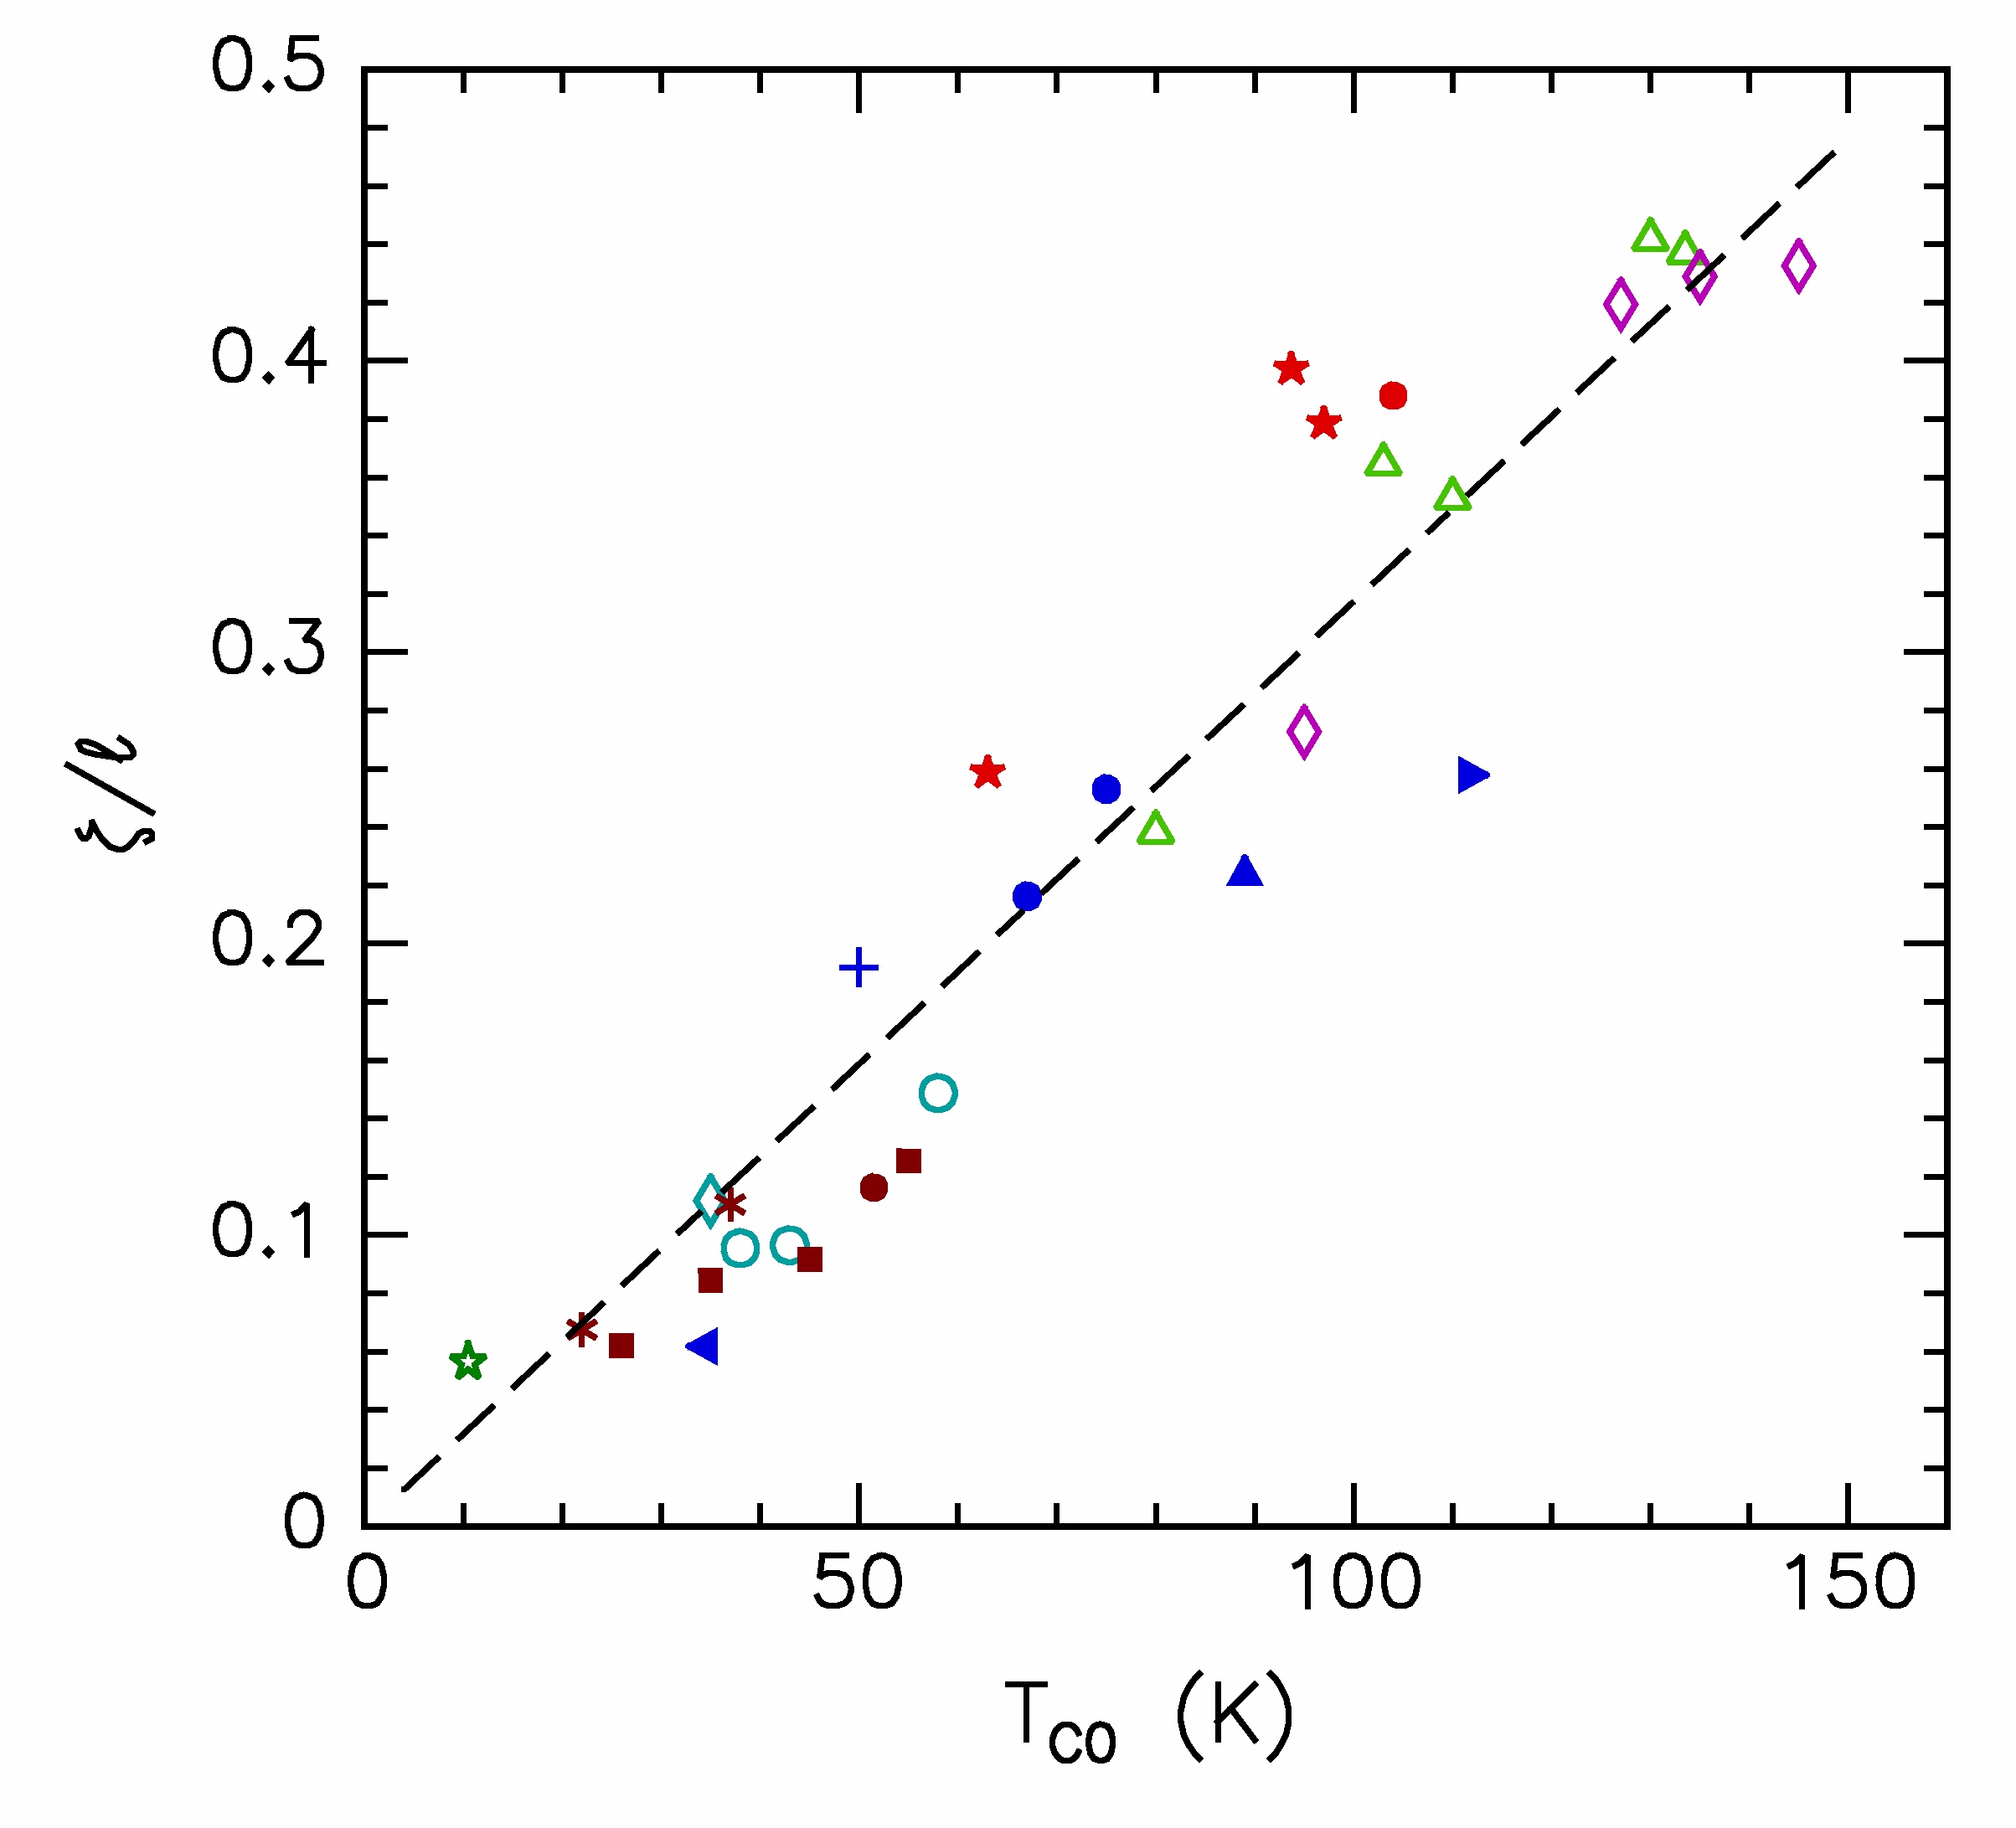 Graph of ζ/ℓ versus TC0 (data from table 1); ζ is the interlayer spacing and ℓ is the mean intralayer distance between superconducting interaction charges. Dashed line denotes trend. Symbols correspond to main figure. |
 Graphs of the interlayer spacing ζ [frame (a)] and the mean intralayer spacing between the superconducting interaction charges ℓ [frame (b)], versus TC0 Dashed line: average ζ; dotted curve: ℓ ∝ 1/TC0. Symbols: see main figure. |
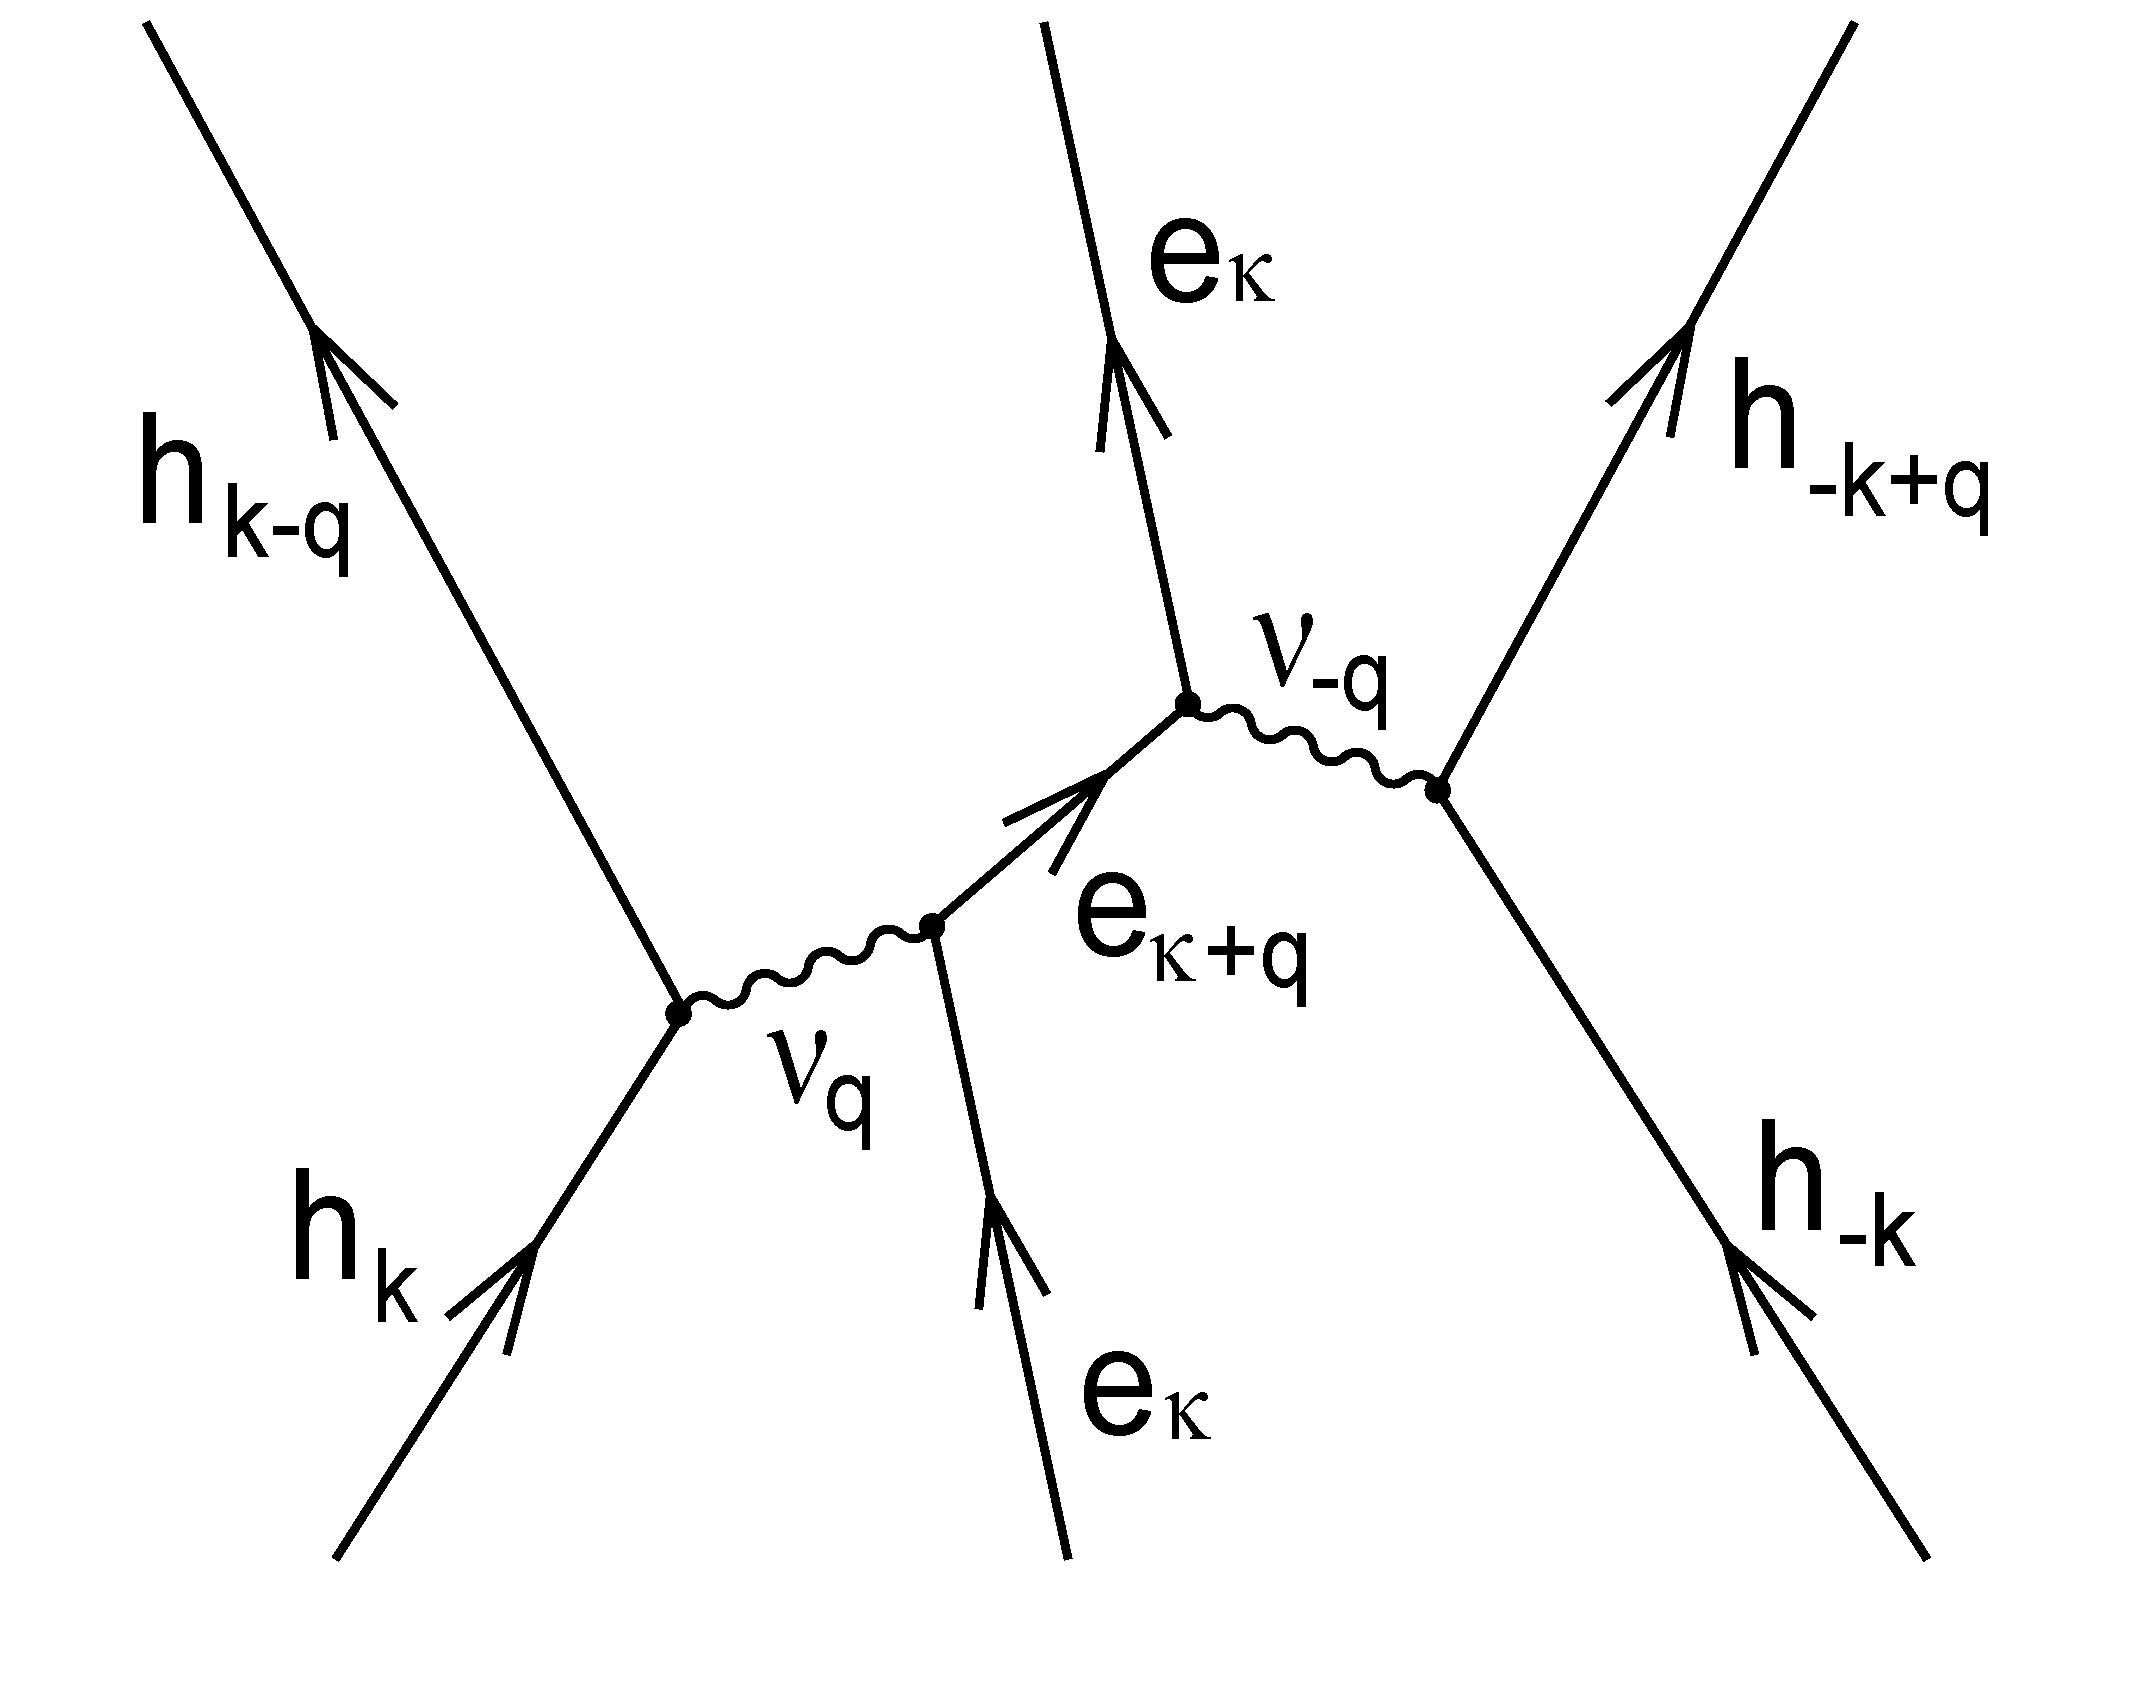 Interaction diagram of the high-TC pairing mechanism, where h, e, and ν denote holes, electronic excitations and photons, respectively; k, κ, and q denote momenta. |
D. R. Harshman, A. T. Fiory and J. D. Dow, J. Phys.: Condens. Matter. 23, 295701 (2011); Corrigendum, J. Phys.: Condens. Matter 23, 349501 (2011). This work is also listed in J. Phys.: Condens. Matter Highlights of 2011.